A boxplot is a chart showing
This tutorial quickly walks you through with some examples.
There's 3 ways to create boxplots in SPSS:
This tutorial walks you through all 3 approaches and uses each for creating a different type of boxplot.
A histogram is a chart showing frequencies for fixed width intervals of a metric variable. This tutorial explains what histograms are and demonstrates why they are useful with illustrations and examples.
Among the very best SPSS practices is running histograms over your metric variables. Doing so is a super fast way to detect problems such as extreme values and gain a lot of insight into your data. This tutorial quickly walks you through.
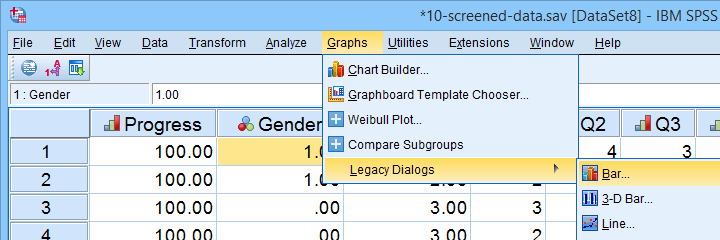
How to create great looking bar charts in SPSS with minimal effort? This tutorial quickly walks you through.
Creating SPSS stacked bar charts with percentages is pretty easy. However, figuring out the right steps may take quite some effort and frustration. This tutorial therefore shows how to do it properly in one go.
This tutorial walks you through creating a clustered bar chart over 2 sets of dichotomous variables.
Before doing so, we'll first restructure our data: we'll mimic a VARSTOCASES command with a cool trick...
Creating a bar chart with means by category is easily done from Graphs - Legacy Dialogs - Bar. Apply some styling with a chart template and you'll be done in a minute.
SPSS chart templates apply styling -colors, borders, fonts and more- to your charts. Chart templates let you run great looking charts super fast in SPSS.
SPSS 25 promises great looking charts by default. This tutorial compares the old and new versions for the most important charts in SPSS.
This tutorial walks you through creating different types of scatterplots in SPSS.
We'll also point out why scatterplots are so useful and how to add regression lines to them.
THIS TUTORIAL HAS 2 COMMENTS:
By SAMINA ASHRAF on September 24th, 2022
I need to make my data normal.
By Ruben Geert van den Berg on September 25th, 2022
We discuss a bunch of options in Normalizing Variable Transformations - 6 Simple Options.
Hope that helps!