A sampling distribution is the frequency distribution of a statistic over many random samples from a single population. Sampling distributions are at the very core of inferential statistics but poorly explained by most standard textbooks. The reasoning may take a minute to sink in but when it does, you'll truly understand common statistical procedures such as ANOVA or a chi-square test.
Sampling Distribution - Example
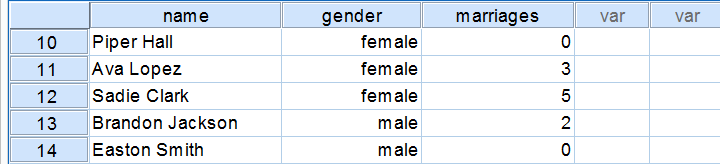
There's an island with 976 inhabitants. Its government has data on this entire population, including the number of times people marry. The screenshot below shows part of these data.
Population Distribution Marriages
Many inhabitants never married (yet), in which case marriages is zero. Other inhabitants married, divorced and remarried, sometimes multiple times. The histogram below shows the distribution of marriages over our 976 inhabitants.
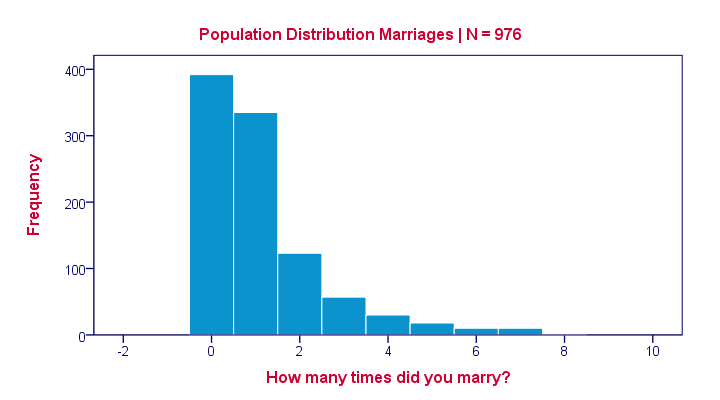
Note that the population distribution is strongly skewed (asymmetrical) which makes sense for these data. On average, people married some 1.1 times as shown by some descriptive statistics below.
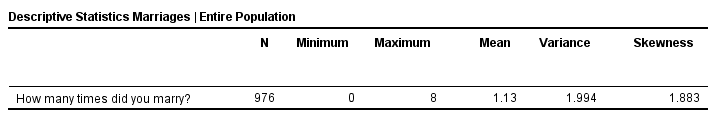
These descriptives reemphasize the high skewness of the population distribution; the skewness is around 1.8 whereas a symmetrical distribution has zero skewness.
Sampling Distribution - What and Why
The government has these exact population figures. However, a social scientist doesn't have access to these data. So although the government knows, our scientist is clueless how often the island inhabitants marry. In theory, he could ask all 976 people and thus find the exact population distribution of marriages. Since this is too time consuming, he decides to draw a simple random sample of n = 10 people.
On average, the 10 respondents married 1.1 times. So what does this say about the entire population of 976 people? We can't conclude that they marry 1.1 times on average because a second sample of n = 10 will probably come up with a (slightly) different mean number of marriages.
This is basically the fundamental problem in inferential statistics: sample statistics vary over (hypothetical) samples. The solution to the problem is to figure out how much they vary. Like so, we can at least estimate a likely range -known as a confidence interval- for a population parameter such as an average number of marriages.
Sampling Distribution - Simulation Study
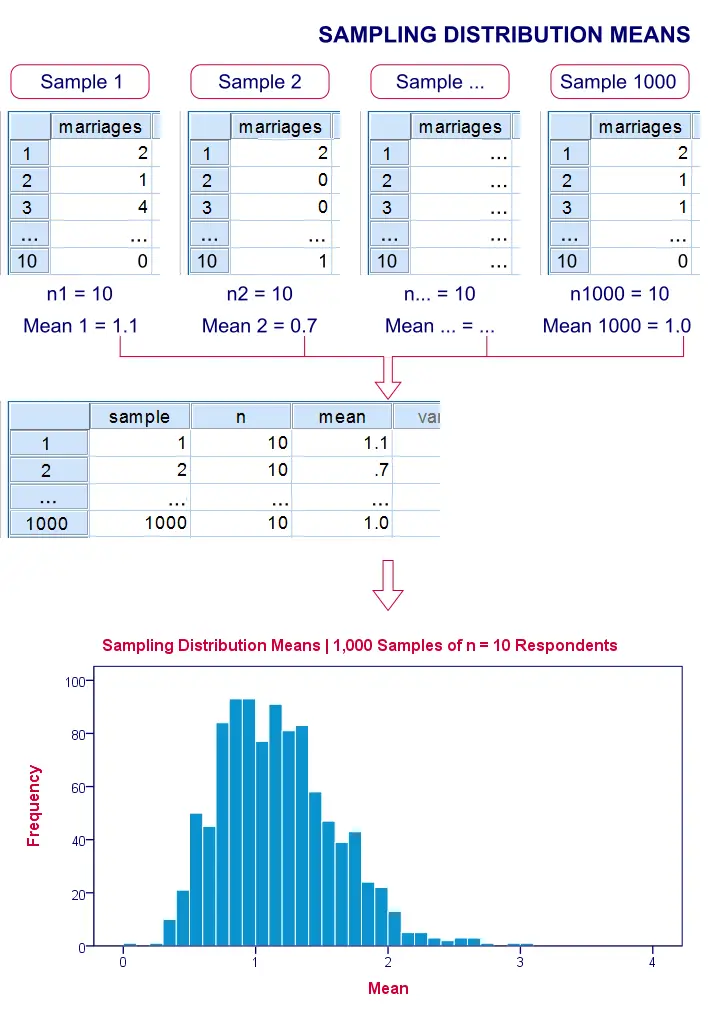
If we draw repeated samples of 10 respondents from our island population, then how much will the average number of marriages vary over such samples? One approach here is a computer simulation (the one below was done with SPSS).
We actually drew 1,000 samples of n = 10 respondents from our population data of 976 inhabitants. We then computed the average number of marriages in each of these samples. A histogram of the outcomes visualizes the sampling distribution: the distribution of a sample statistic over many repeated samples.
Sampling Distribution - Central Limit Theorem
The outcome of our simulation shows a very interesting phenomenon: the sampling distribution of sample means is very different from the population distribution of marriages over 976 inhabitants: the sampling distribution is much less skewed (or more symmetrical) and smoother.
In fact, means and sums are always normally distributed (approximately) for reasonable sample sizes, say n > 30. This doesn't depend on whatever population distribution the data values may or may not follow.It does, however, require independent and identically distributed variables, which is a common assumption for most applied statistics. This phenomenon is known as the central limit theorem.
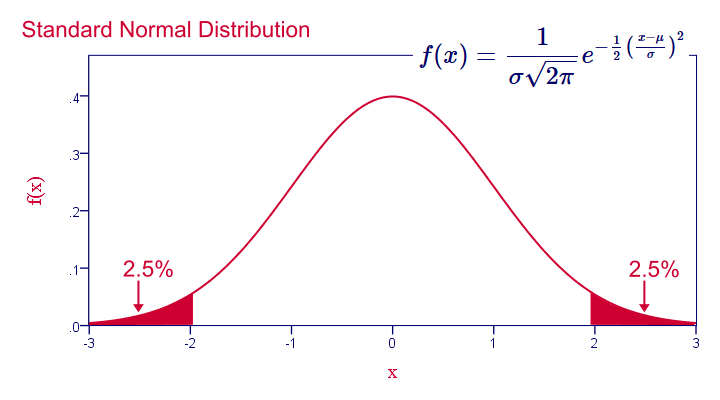
Note that even for 1,000 samples of n = 10, our sampling distribution of means is already looking somewhat similar to the normal distribution shown below.
Standard Normal Distribution
Common Sampling Distributions
The sampling distributions you'll encounter most in practice all derive from the normal distribution implied by the central limit theorem. This holds for
- the normal distribution for sample means, sums, percentages and proportions;
- the t distribution for sample means in a t-test and beta coefficients in regression analysis;
- the chi-square distribution for variances;
- the F-distribution for variance ratios in ANOVA.
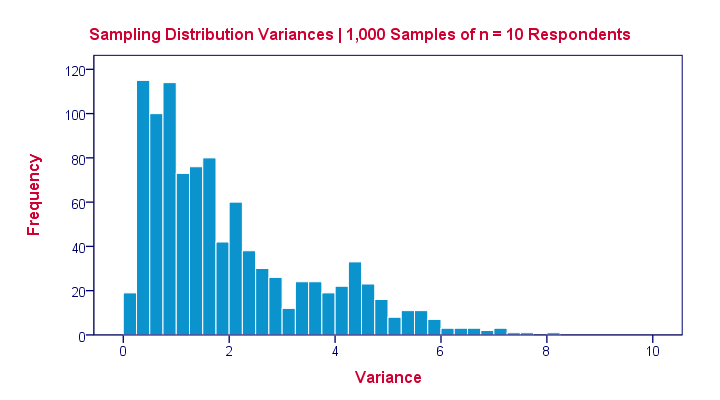 The sampling distribution for a variance approximates a chi-square distribution rather than a normal distribution.
Sampling Distribution - Importance
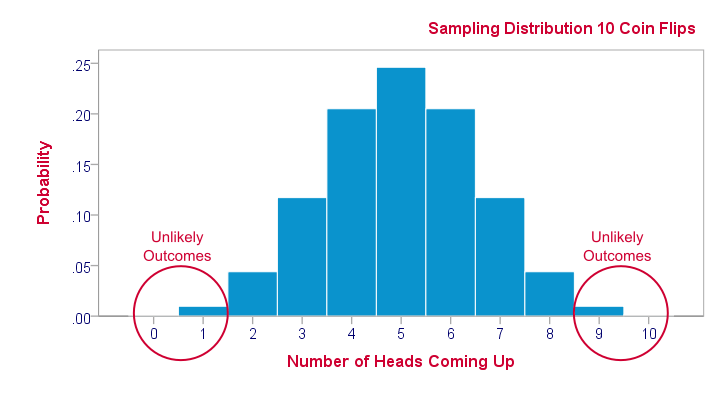
Sampling distributions tell us which outcomes are likely, given our research hypotheses. So perhaps our hypothesis is that a coin is balanced: both heads and tails have a 50% chance of landing up after a flip. This hypothesis implies the sampling distribution shown below for the number of heads resulting from 10 coin flips.
This tells us that from 1,000 such random samples of 10 coin flips, roughly 10 samples (1%) should result in 0 or 1 heads landing up. We therefore consider 0 or 1 heads an unlikely outcome. If such an outcome occurs anyway, then perhaps the coin wasn't balanced after all. We reject our hypothesis of equal chances for heads and tails and conclude that heads has a lower than 50% chance of landing up.
THIS TUTORIAL HAS 11 COMMENTS:
By liat on September 7th, 2022
Thanks a lot !!!! I will definitely read the book you recommended. The majority of Google searches refer to nonparametric tests synonymously with distribution-free tests. Do you have any suggestions as to where I may find the specific differences between the two?