SPSS McNemar test is a procedure for testing if the proportions of two dichotomous variables are equal in some population. The two variables have been measured on the same cases.
SPSS McNemar Test Example
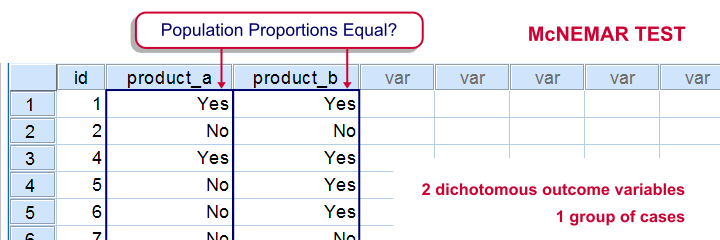
A marketeer wants to know whether two products are equally appealing. He asks 20 participants to try out both products and indicate whether they'd consider buying each products (“yes” or “no”). This results in product_appeal.sav. The proportion of respondents answering “yes, I'd consider buying this” indicates the level of appeal for each of the two products.
The null hypothesis is that both percentages are equal in the population.
1. Quick Data Check
Before jumping into statistical procedures, let's first just take a look at the data. A graph that basically tells the whole story for two dichotomous variables measured on the same respondents is a 3-d bar chart. The screenshots below walk you through.

We'll first navigate to
![]()
![]() Click .
Click .

 Select and move
product_a and 
product_b into the appropriate boxes. Clicking results in the syntax below.
cd 'd:downloaded'. /*or wherever data file is located.
*2. Open data.
get file 'product_appeal.sav'.
*3.Quick data check.
XGRAPH CHART=([COUNT] [BAR]) BY product_a [c] BY product_b [c].

The most important thing we learn from this chart is that both variables are indeed dichtomous. There could have been some “Don't know/no opinion” answer category but both variables only have “Yes” and “No” answers. There are no system missing values since the bars represent (6 + 7 + 7 + 0 =) 20 valid answers which equals the number of respondents.
Second, product_b is considered by (6 + 7 =) 13 respondents and thus seems more appealing than product_a (considered by 7 respondents). Third, all of the respondents who consider product_a consider product_b as well but not reversely. This causes the variables to be positively correlated and asks for a close look at the nature of both products.
2. Assumptions McNemar Test
The results from the McNemar test rely on just one assumption:
- independent and identically distributed variables (or, less precisely, “independent observations”);
3. Run SPSS McNemar Test

We'll navigate to
![]()
![]()
![]() .
.

We select both product variables and move them into the box.
Under , we'll select .
We only select under
 Clicking results in the syntax below.
NPAR TESTS
/MCNEMAR=product_a WITH product_b (PAIRED)
/STATISTICS DESCRIPTIVES.
4. SPSS McNemar Test Output

The first table (Descriptive Statistics) confirms that there are no missing values. We already saw this in our chart as well.If there are missing values, these descriptives may be misleading. This is because they use pairwise deletion of missing values while the significance test (necessarily) uses listwise deletion of missing values. Therefore, the descriptives may use different data than the actual test. This deficiency can be circumvented by (manually) FILTERING out all incomplete cases before running the McNemar test.
Note that SPSS reports means rather than proportions. However, if your answer categories are coded 0 (for “absent”) and 1 (for “present”) the means coincide with the proportions.We suggest you RECODE your values if this is not the case. The proportions are (exactly) .35 and .65. The difference is thus -.3 where we expected 0 (equal proportions).

The second table (Test Statistics) shows that the p-value is .031. If the two proportions are equal in the population, there's only a 3.1% chance of finding the difference we observed in our sample. Usually, if p < .05, we reject the null hypothesis. We therefore conclude that the appeal of both products is not equal.
Note that the p-value is two-sided. It consists of a .0155 chance of finding a difference smaller than (or equal to) -.3 and another .0155 chance of finding a difference larger than (or equal to) .3.
5. Reporting the McNemar Test Result
In any case, we report the two proportions and the sample size on which they were based, probably in the style of the descriptives table we saw earlier. For reporting the significance test we can write something like “A McNemar test showed that the two proportions were different, p = .031 (2 sided).”
THIS TUTORIAL HAS 4 COMMENTS:
By Sophie on November 22nd, 2015
"p-value is two-sided. It consists of a .155 chance..."
shouldn't it be 0.0155 chance, since it is 3.1%? 3.1/100/2=0.0155, and not 0.155.
By Ruben Geert van den Berg on November 22nd, 2015
You are totally right! That's a nasty typo. Thanks a lot for pointing that out, we appreciate it!
By serah greno on August 5th, 2022
Well explained tutorial. I enjoyed every part of it.
By Ronelo Cablinda on December 18th, 2022
superb! thanks for sharing