The vast majority of statistical tests fall into one of 6 basic types:
Look up which type of test is right for your data and you'll see which test you should use.
When analyzing data in SPSS, which steps should we take in which order?
This roadmap walks you through our basic data analysis routines -from inspecting and editing your data through your final tables, charts and tests.
This tutorial walks through running nice tables and charts for investigating the association between categorical or dichotomous variables. We'll demonstrate some cool SPSS tricks along the way.
This tutorial shows how to create nice tables and charts for studying the association between a dichotomous and a metric variable. If statistical assumptions are met, these may be followed up by an independent samples t test.
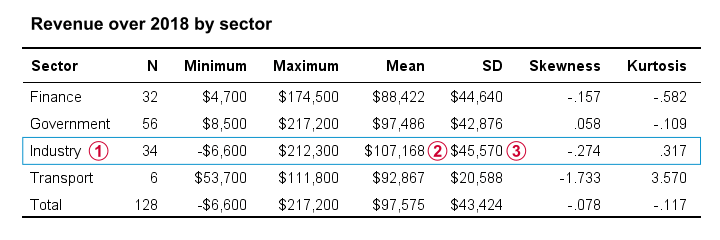
A previous tutorial introduced some summary statistics appropriate for both categorical as well as metric variables. Now it's time to turn to some measures that apply to metric variables exclusively. The most important ones are the mean (or average), variance and standard deviation.
When analyzing your data, you sometimes just want to gain some insight into variables separately. The first step in doing so is creating appropriate tables and charts. This tutorial shows how to do so for dichotomous or categorical variables.
This tutorial shows how to create nice tables and charts for comparing multiple dichotomous variables. We'll use some cool tricks for doing so.
This tutorial shows how to create nice tables and charts for comparing multiple categorical variables. This approach is suitable for variables having identical value labels and comparable contents.
This tutorial shows how to create proper tables and means charts for multiple metric variables. We'll use some cool tricks along the way for getting the most out of our output.
THIS TUTORIAL HAS 41 COMMENTS:
By Shafqat KHANZADA on March 30th, 2026
Biostatistics