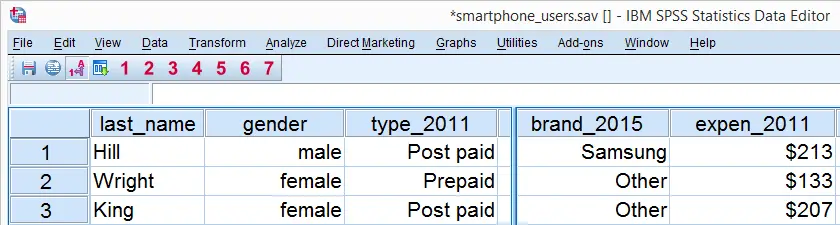
When analyzing your data, you sometimes just want to gain some insight into variables separately. The first step in doing so is creating appropriate tables and charts. This tutorial shows how to do so for dichotomous or categorical variables. We recommend you follow along by downloading and opening smartphone_users.sav.
SPSS Frequency Tables
We'd like to know which smartphone brands were most popular in 2011. Our data contains a variable brand_2011 holding the relevant data. Since this is a categorical variable, a suitable table here is a simple frequency table as obtained with FREQUENCIES. The syntax below shows how to run it.
set tnumbers labels tvars labels.
*2. Create frequency table.
frequencies brand_2011.
Result
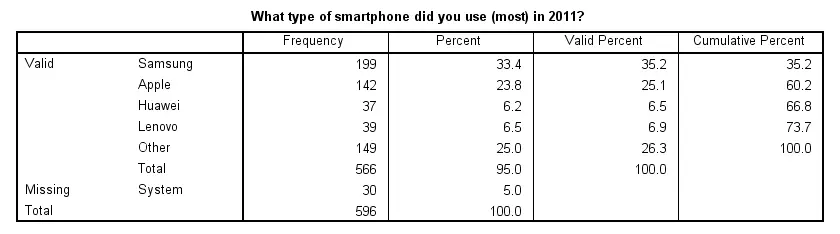
Note that there's some system missing values. Presuming these occurred due to respondents not using a smartphone in the first place, we'll report the figures under “Percent”. Conclusion: in 2011, 33% of our respondents used a Samsung smartphone, making it the most popular brand during that year.
SPSS Bar Charts for Categorical Variable
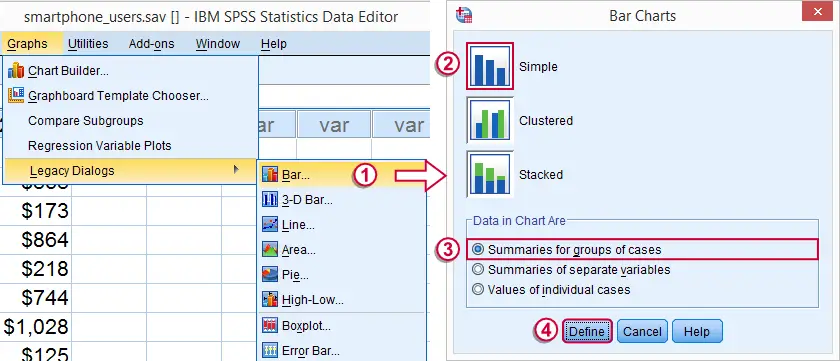
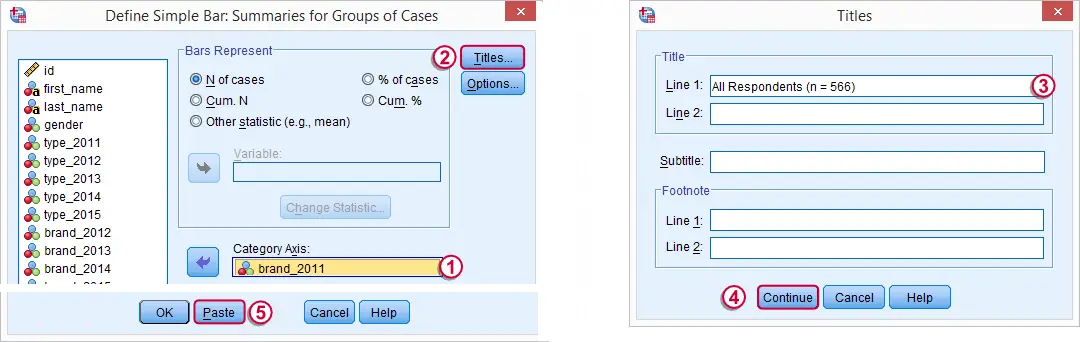
Our frequency table provides us with the necessary information but we need to look at it carefully for drawing conclusions. Doing so is greatly facilitated by creating a simple bar chart with bars representing frequencies. The fastest way to do so is including it in our FREQUENCIES command but this doesn't allow us to add a title. We'll therefore do it differently as shown by the screenshots below.
SPSS Bar Chart Syntax Example
GRAPH
/BAR(SIMPLE)=COUNT BY brand_2011
/title 'All Respondents (n = 566)'.
Result
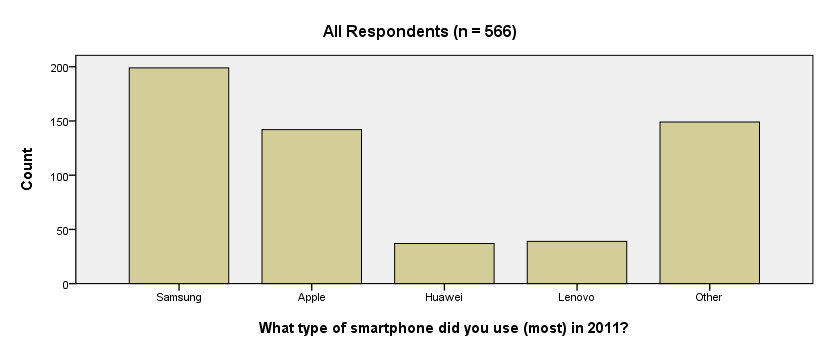
We now have our basic bar chart. For a serious report, however, you probably want a better looking chart. A great way for prettifying charts is discussed in SPSS Chart Templates - Quick Introduction.
System Missing Values
Thus far, we simply ignored the system missing values we saw in our frequency table. For nominal variables, an alternative approach is including them as just another answer category. The syntax below does just that for all brand variables. We'll first inspect which values are present. Next, we'll RECODE system missing values into a value that wasn't present yet. In our case that will be 6.
SPSS RECODE Syntax Example
set tnumbers both.
*2. Inspect which values are present in brand variables.
frequencies brand_2011 to brand_2015.
*3. Change system missing values to 6.
recode brand_2011 to brand_2015 (sysmis = 6).
*4. Apply value label to new value.
add value labels brand_2011 to brand_2015 6 '(No answer)'.
*5. Show only value labels in output tables.
set tnumbers labels.
*6. Rerun frequency tables.
frequencies brand_2011 to brand_2015.
Result
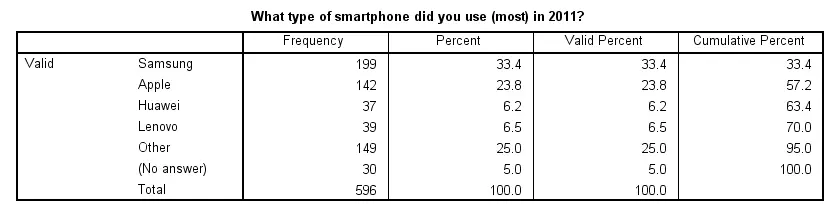
Note that our frequency table no longer includes any missing values. They've been converted to 6, which is labeled “(No answer)” and occurs 30 times for this variable.
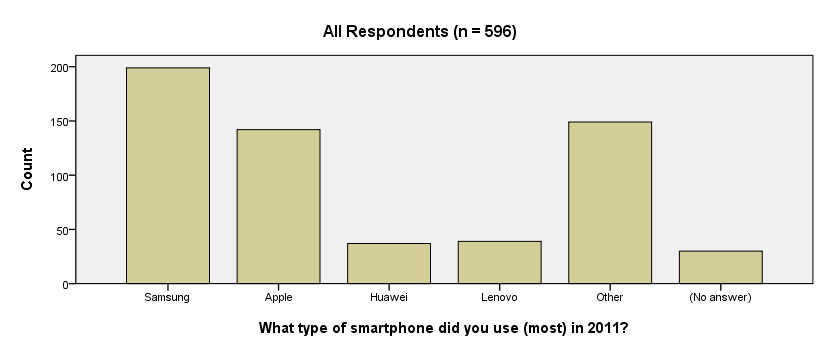
We see that recoding system missing values make our frequency tables look better but there's another advantage: because the brand variables don't contain missing values anymore, their bar charts will all be based on the same number of respondents. This circumvents the need for specifying different numbers of respondents in their titles; we can create them very easily by copy-pasting-editing the syntax we used previously. The syntax below illustrates the idea.
SPSS Bar Charts Syntax Example
GRAPH /BAR(SIMPLE)=COUNT BY brand_2011 /TITLE='All Respondents (n = 596)'.
GRAPH /BAR(SIMPLE)=COUNT BY brand_2012 /TITLE='All Respondents (n = 596)'.
GRAPH /BAR(SIMPLE)=COUNT BY brand_2013 /TITLE='All Respondents (n = 596)'.
Result
THIS TUTORIAL HAS 15 COMMENTS:
By Chris on March 9th, 2016
Great website! After many years off, I need to purchase SPSS again. Not sure where to place my question...
I know that the SPSS Tables Original (Basic Tables, General Tables, Multiple Response Tables, Tables of Frequencies) user interface is no longer available and no longer supported. However, some sources on the internet note that the "existing TABLES syntax should continue to work". Do you know if the TABLES syntax will work in SPSS Statistics Base. I would download a trial, but the trial version is not SPSS Statistics Base. More to the point, I don't need to purchase a CUSTOM TABLES module if I can use the TABLES command in SPSS Statistics Base.
By Ruben Geert van den Berg on March 11th, 2016
Hi Chris!
I obviously can't guarantee that TABLES will keep on working. However, SPSS seems almost obsessed with backward compatibility so I find it highly unlikely they'll discontinue support.
More importantly, the TABLES command demonstrated here is the only one I found useful so far. Since it can be replaced by VARSTOCASES followed by CROSSTABS, I don't see any need for TABLES in the first place.
Alternatively, we may (or may not) start working on a workaround for CUSTOM TABLES: create the actual table data as a dataset and convert it into an SPSS output table by means of Python scripting. Like so, you can easily create any table you can imagine but the conversion to an output table will take some effort to set up.
Exactly what kind of table do you need anyway? Could you perhaps upload an example screenshot for us?
By Adekunle Adurapemi on July 8th, 2016
Please can u send this tutorial to my email address?
Thanks
By Ruben Geert van den Berg on July 8th, 2016
Hi Adekunie! Our tutorials are available online only. You can save it via your web browser if you want to but you may lose some functionality such as hyperlinks and hidden comments.
By Pooja on October 23rd, 2018
Helpful for us!