SPSS CROSSTABS produces contingency tables: frequencies for one variable for each value of another variable separately. If assumptions are met, a chi-square test may follow to test whether an association between the variables is statistically significant. This tutorial, however, aims at quickly walking through the main options for CROSSTABS.
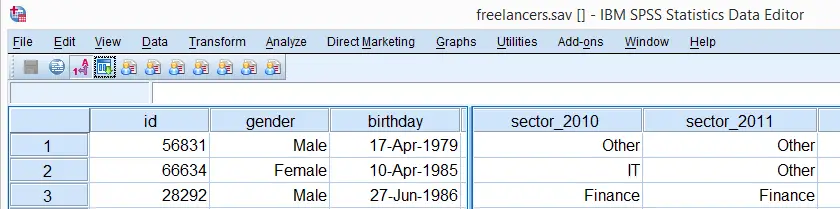
We'll use freelancers.sav throughout this tutorial as a test data file.
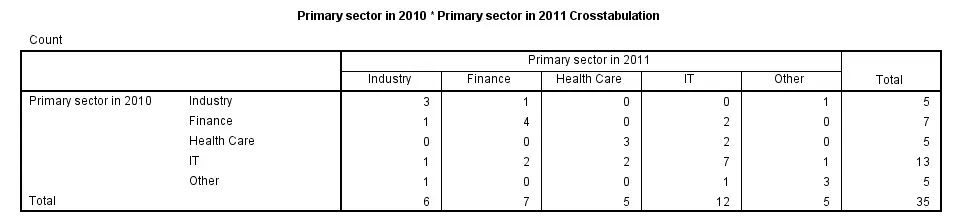
SPSS CROSSTABS - Minimal Specification
The syntax below demonstrates the simplest possible CROSSTABS command. It generates a table with the frequencies for sector_2010 for each value in sector_2011 separately. The screenshot below shows the result.
crosstabs sector_2010 by sector_2011.
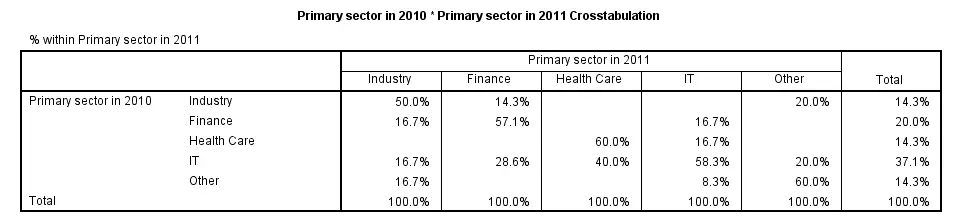
SPSS CROSSTABS - CELLS Subcommand
By default, CROSSTABS shows only frequencies (counts). However, the association between variables usually become more visible by displaying row or column percentages. They can be obtained by adding a CELLS subcommand.
Note that multiple cell contents may be chosen simultaneously; the second example below includes both column percentages and frequencies. Specifying ALL on the CELLS subcommand gives a complete overview of the options.
crosstabs sector_2010 by sector_2011/cells column.
*2. Crosstabs with both frequencies and column percentages in cells.
crosstabs sector_2010 by sector_2011/cells count column.
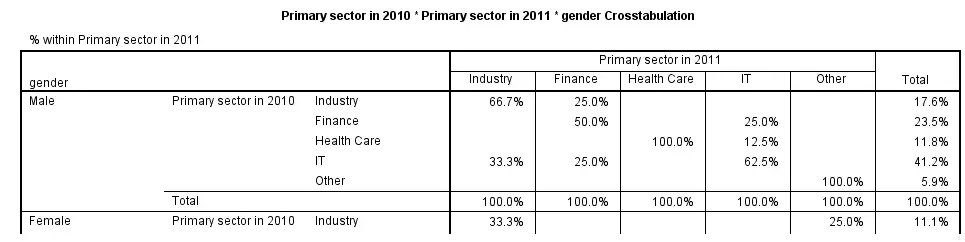
SPSS CROSSTABS - Multiway Tables
Multiway tables result from including more than one BY clause in CROSSTABS. Like so, the syntax below produces frequencies of sector_2011 for each combination of gender and sector_2010 separately. The following screenshot shows (part of) the result.
crosstabs sector_2010 by sector_2011 by gender
/cells column.
SPSS CROSSTABS - Multiple Tables, Similar Columns
Multiple tables with the same column variable but different row variables can be generated by a single CROSSTABS command; simply specify multiple variable names (possibly using TO) before the BY keyword. The syntax below gives an example.
crosstabs sector_2011 to sector_2014 by sector_2010.
SPSS CROSSTABS - Multiple Tables, Similar Rows
Multiple variables being specified after the BY keyword results in multiple tables with different column variables but the same row variable.
crosstabs sector_2010 by sector_2011 to sector_2014.
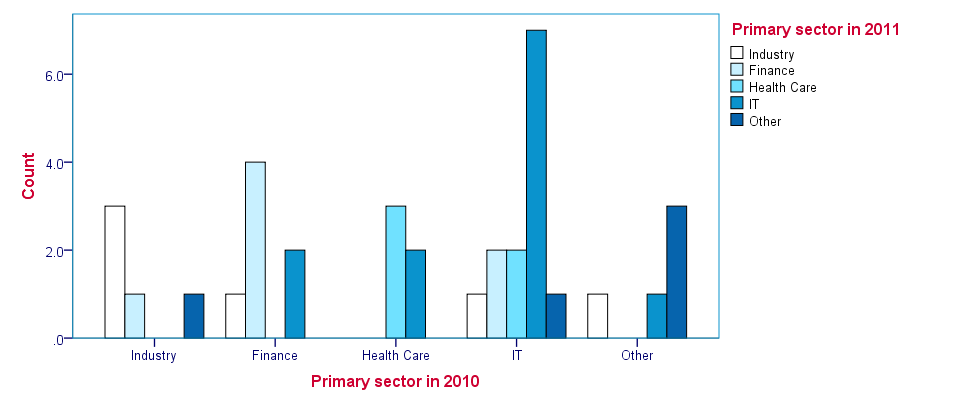
SPSS CROSSTABS - BARCHART Subcommand
Clustered barcharts can be obtained from CROSSTABS by simply adding a BARCHART subcommand as shown below. However, we prefer to generate such charts via GRAPH because it allows us to set appropriate titles for our charts.
Charts resulting from either option can be styled with an SPSS Chart Template (.sgt) file, which we used for the following screenshot.
crosstabs sector_2010 by sector_2011
/cells column
/barchart.
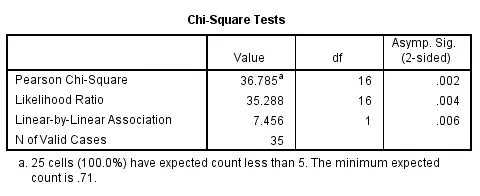
SPSS CROSSTABS - STATISTICS Subcommand
As mentioned in the introduction of this tutorial, CROSSTABS offers a chi-square test for evaluating the statistical significance of an association among the variables involved. It's obtained by specifying CHISQ on the STATISTICS subcommand.
Do keep in mind that SPSS happily produces test results even if their statistical assumptions don't hold, in which case such results may be wildly incorrect.
Besides the chi-square test statistic, many other statistics are available. For a full overview, specify ALL on the STATISTICS subcommand or consult the command syntax reference.
crosstabs sector_2010 by sector_2011
/cells column
/statistics chisq.
THIS TUTORIAL HAS 6 COMMENTS:
By Cynthia M. Terrell on May 30th, 2020
When the cross tabs are incorrect, how does it effect the data and can you go back and correct it without running the test again?