Basic frequency tables created in SPSS look monstrous. This tutorial shows how to create nice and clean APA format tables with a simple trick.
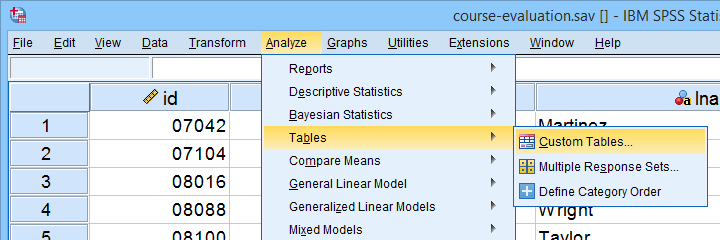
Running simple contingency tables in SPSS is easy enough. However, the default format is very inconvenient and doesn't meet APA standards. This tutorial shows 3 ways to create better tables.
This tutorial quickly walks you through some handy routines for creating APA style tables for
For APA format descriptives tables, avoid DESCRIPTIVES. Instead, use MEANS and transpose the resulting tables. This tutorial guides you through.
SPSS CROSSTABS is used for
This quick tutorial walks you through some examples.
SPSS MEANS produces tables containing means and/or other statistics for different groups of cases. These groups are defined by one or more categorical variables. If assumptions are met, MEANS can be followed up by an ANOVA.
SPSS CORRELATIONS creates tables with Pearson correlations, sample sizes and significance levels.
Its syntax can be as simple as correlations q1 to q5. which creates a correlation matrix for variables q1 through q5. This simple tutorial quickly walks you through some other options as well.
SPSS DESCRIPTIVES generates a single table with descriptive statistics for one or more variables. It can also add z-scores to your data.
SPSS FREQUENCIES is found under Analyze - Descriptive Statistics - Frequencies. It is ideal for running
THIS TUTORIAL HAS 2 COMMENTS:
By Getahun on April 27th, 2020
I am doing my reserach. Hence I need help for my data analysis using spss and chi square. Could you help me?
By Ruben Geert van den Berg on April 28th, 2020
Hi Getahun!
We offer personal assistance with SPSS and statistics. This costs $ 50,- (USD) per hour for students. Please contact us at [email protected] for inquiries.
Hope that helps!
SPSS tutorials