The nth percentile is the value that separates
the lowest n% of values from the other values.
Example: the 10th percentile for body weight is 60 kilos. This means that 10% of all people weigh less than 60 kilos and 90% of people weigh more.
- Percentiles - Simple Example
- Percentiles - Interpolation Formula
- PERCENTILE.EXC or PERCENTILE.INC?
- Percentiles in SPSS
- Quartiles, Median & Boxplots
Percentiles - Simple Example
Some fishermen catch and measure 100 trouts. The data thus obtained are in this Googlesheet, partly shown below.
So what's the 10th percentile for the length of these trouts? For our 100 observations, this is super easy. We simply
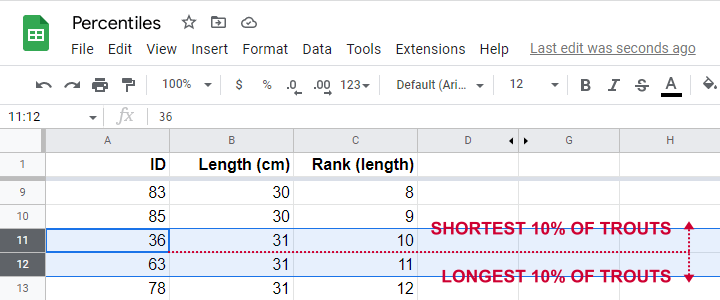
- sort our lengths ascendingly;
- rank our lengths while ignoring ties (values that occur more than once);
- find the length between observations 10 (10% of 100 observations) and 11 (the next observation).
As shown in the screenshot above, observations 10 and 11 both have a length of 31 centimeters. This is the 10th percentile for length as either Excel or SPSS will readily confirm.
Sadly, things are rarely that simple with real life data. For example, how to find the 15th percentile from N = 141 observations?
In this case, we'd better use one or two simple formulas. We'll demonstrate them in order to find the 15th percentile for length.
Percentiles - Rank Formula
Percentile \(pct\) is the value that has \(Rank_{pct}\) defined as
$$Rank_{pct} = \frac{pct}{100} \cdot (N + 1)$$
where
- \(Rank_{pct}\) denotes the rank for some percentile \(pct\) and;
- \(N\) denotes the sample size or population size.
So the 15th percentile for 100 observations is the observation with rank
$$Rank_{15} = \frac{15}{100} \cdot (100 + 1) = 15.15$$
Sadly, there is no observation with rank 15.15. So we look at the nearest ranks, 15 and 16 in our Googlesheet.
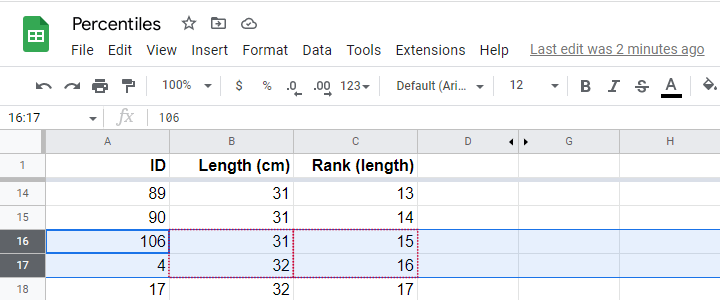
Note that
- observation 15 has a length of 31 centimeters and
- observation 16 has a length of 32 centimeters.
If both values would have been equal -as between ranks 10 and 11, both 31 centimeters- we would have reported this value. However, the 15th percentile is some value between 31 centimeters (rank 15) and 32 centimeters (rank 16).
If may be tempting to simply report the average, 31.5 centimeters. However, 15.15 is closer to rank 15 than rank 16. This is usually taken into account by linear interpolation.
Percentiles - Interpolation Formula
For non integer ranks, exact percentiles are usually computed with
$$Pct = X_{tr} + (X_{tr + 1} - X_{tr}) \cdot ({r - tr})$$
where
- \(Pct\) denotes the desired percentile;
- \(r\) denotes the decimal rank for the desired percentile;
- \(tr\) denotes the truncated rank for the desired percentile;
- \(X_{tr}\) denotes the score for the truncated rank;
- \(X_{tr + 1}\) denotes the score for the truncated rank + 1.
For our example, this results in
$$Pct = 31 + (32 - 31) \cdot ({15.15 - 15}) = 31.15$$
Our Googlesheet shows  how to implement this formula and
  its outcome.
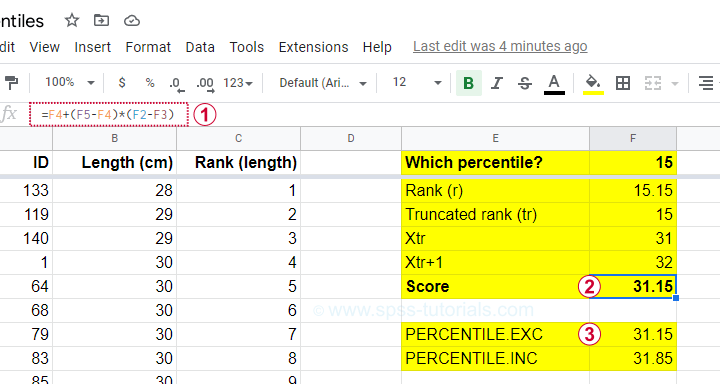
 Note that we replicated this outcome with the built-in function for percentiles, which is
=PERCENTILE.EXC(B2:B101,0.15)
in Googlesheets as well as Excel. As we'll see in a minute, SPSS yields the same outcome.
Note that we replicated this outcome with the built-in function for percentiles, which is
=PERCENTILE.EXC(B2:B101,0.15)
in Googlesheets as well as Excel. As we'll see in a minute, SPSS yields the same outcome.
PERCENTILE.EXC or PERCENTILE.INC?
You may have noticed that Excel and Googlesheets contain 2 different percentile formulas:
- PERCENTILE.EXC excludes percentiles 0 and 100. That is, these are undefined.
- PERCENTILE.INC defines percentile 0 as the minimum and percentile 100 as the maximum.
So which one is best?
My personal opinion is that PERCENTILE.EXC makes more sense given our definition:
the nth percentile is the value that separates
the lowest n% of values from the other values.
This implies that the zeroeth percentile would be the value that separates the lowest 0% (?!?!) of all values from the others.
This -and therefore PERCENTILE.INC- doesn't make a lot of sense to me. But if you disagree, I'll be happy to hear from you.
Percentiles in SPSS
SPSS users may first download and open trout.sav. Now, the simplest way to find percentiles is from
![]()
![]() and fill out the dialogs as shown below.
and fill out the dialogs as shown below.
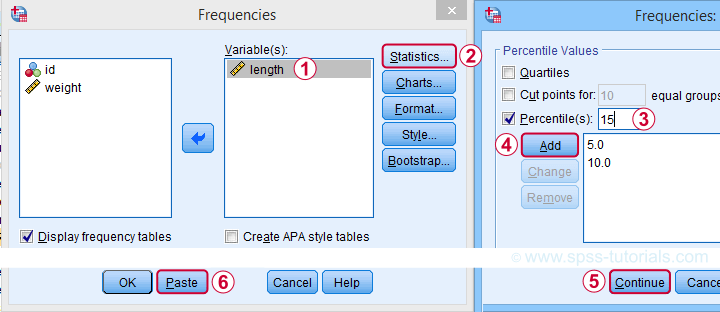
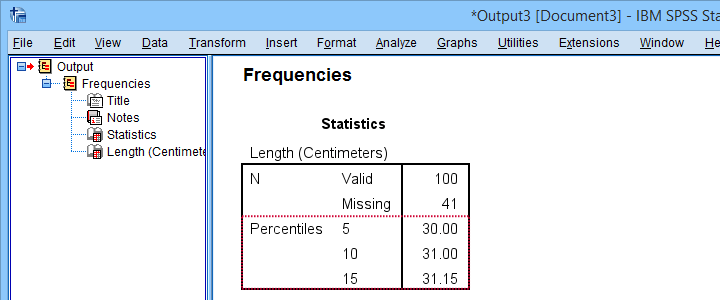
A much faster option is to use SPSS syntax like the one shown below.
frequencies length
/percentiles 5 10 15.
Completing these steps confirms once more 31.15 centimeters as the 15th percentile for the lengths of our trouts.
Quartiles, Median & Boxplots
The percentiles that are most often reported are
- the 25th percentile, also known as quartile 1;
- the 50th percentile, also known as quartile 2 or the median;
- the 75th percentile, also known as quartile 3.
These percentiles are often reported in boxplots such as the one shown below.

Percentiles - Conceptual Issues
Last but not least, I'd like to point out 2 conceptual issues with percentiles that are mentioned by few text books.
First off, in case of ties, percentiles may not exactly separate the lowest n% of observations from the others. Regarding our first example,
- 9.0% of trouts have a length smaller than 31 centimeters;
- 6.0% of trouts have a length equal to 31 centimeters;
- 85.0% of trouts have a length greater than 31 centimeters.
Note that there is no single value here that exactly separates the lowest 10% from all other observations.
The second conceptual issue is the opposite: in some cases, an infinite number of values exactly separate the lowest n% of values. This holds for our second example, which came up with a rank of 15.15.
Remember that ranks 15 and 16 corresponded to 31 and 32 centimeters. Our interpolation formula came up with 15.15 centimeters but
- 31.0000001 centimeters also exactly separates the lowest 15%,
- 31.0000002 centimeters also exactly separates the lowest 15%,
- and so on...
Fortunately, these conceptual issues rarely plague real-world data analysis.
Right, so that'll do. If you've any questions or remarks, please throw me a comment below. Other than that,
Thanks for reading!
THIS TUTORIAL HAS 3 COMMENTS:
By Jon K Peck on September 19th, 2022
Percentiles can get more complicated. Different definitions are in use. Weights and grouped data complicate the calculation. FREQUENCIES offers the GROUPED option for data where the values are group midpoints or collapsed along with some variations. The EXAMINE procedure offers five different ways of computing percentiles. The Command Syntax Reference shows these formulas better.
HAVERAGE. Weighted average at X(w + 1)p. The percentile value is the weighted average of X i and X i + 1,
where i is the integer part of (w + 1)p. This is the default if PERCENTILES is specified without a keyword.
WAVERAGE. Weighted average at Xwp. The percentile value is the weighted average of X i and X (i + 1),
where i is the integer portion of wp.
ROUND. Observation closest to wp. The percentile value is X i or X i + 1, depending upon whether i or i + 1 is
"closer" to wp.
EMPIRICAL. Empirical distribution function. The percentile value is X i, where i is equal to wp rounded up
to the next integer.
AEMPIRICAL. Empirical distribution with averaging. This is equivalent to EMPIRICAL, except when i=wp,
in which case the percentile value is the average of X i and X i + 1.
By Ruben Geert van den Berg on September 20th, 2022
Hi Jon, thanks for the feedback!
I'm planning a tutorial on percentiles in SPSS that covers FREQUENCIES and EXAMINE with the different formulas. One thing I'll point out is that EXAMINE can yield percentiles for separate groups without the need for any SPLIT FILE.
I wasn't aware of the GROUPED subcommand so I'll experiment with that in due course and see if I find it helpful. The CSR is rather elaborate on it, and it looks fairly interesting.
There's no equivalent of PERCENTILE.INC in SPSS, is there? One thing that struck me is that this is the default in GoogleSheets (when using just "=PERCENTILE(...)").
By Jon Peck on September 21st, 2022
I'm not sure about .exc vs .inc. The exact formulas used by EXAMINE are in the Algorithms manual.
I should also mention the STATS NTILE ANALYSIS extension command. It displays statistics for the ntiles of a dataset of predicted probabilities and associated charts.