- Introduction
- Creating APA Tables - the Easy Way
- Table I - Factor Loadings & Communalities
- Table II - Total Variance Explained
- Table III - Factor Correlations
Introduction
Creating APA style tables from SPSS factor analysis output can be cumbersome. This tutorial therefore points out some tips, tricks & pitfalls. We'll use the results of SPSS Factor Analysis - Intermediate Tutorial.
All analyses are based on 20-career-ambitions-pca.sav (partly shown below).
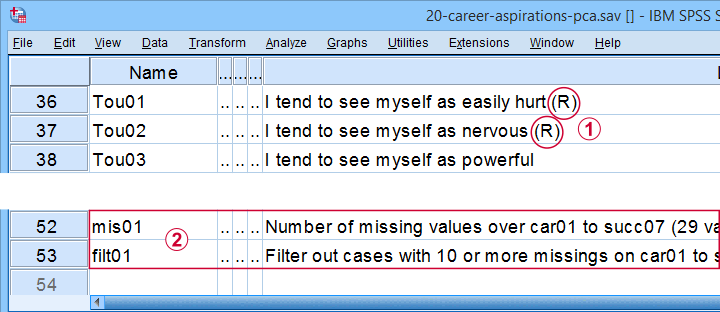
 Note that some items were reversed and therefore had “(R)” appended to their variable labels;
 We'll FILTER out cases with 10 or more missing values.
After opening these data, you can replicate the final analyses by running the SPSS syntax below.
filter by filt01.
*PCA VI - AS PREVIOUS BUT REMOVE TOU04.
FACTOR
/VARIABLES Car01 Car02 Car03 Car04 Car05 Car06 Car07 Car08 Conf01 Conf02 Conf03 Conf05 Conf06
Comp01 Comp02 Comp03 Tou01 Tou02 Tou05 Succ01 Succ02 Succ03 Succ04 Succ05 Succ06
Succ07
/MISSING PAIRWISE
/PRINT INITIAL EXTRACTION ROTATION
/FORMAT SORT BLANK(.3)
/CRITERIA FACTORS(5) ITERATE(25)
/EXTRACTION PC
/ROTATION PROMAX
/METHOD=CORRELATION.
Creating APA Tables - the Easy Way
For a wide variety of analyses, the easiest way to create APA style tables from SPSS output is usually to
- adjust your analyses in SPSS so the output is as close as possible to the desired end results. Changing table layouts (which variables/statistics go into which rows/columns?) is also best done here.
- copy-paste one or more tables into Excel or Googlesheets. This is the easiest way to set decimal places, fonts, alignment, borders and more;
- copy-paste your table(s) from Excel into WORD. Perhaps adjust the table widths with “autofit”, and you'll often have a perfect end result.
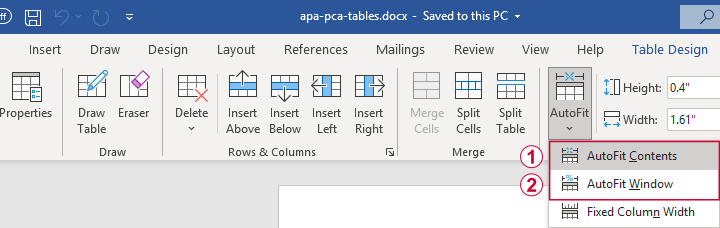 Autofit to Contents, then Window results in optimal column widths
Table I - Factor Loadings & Communalities
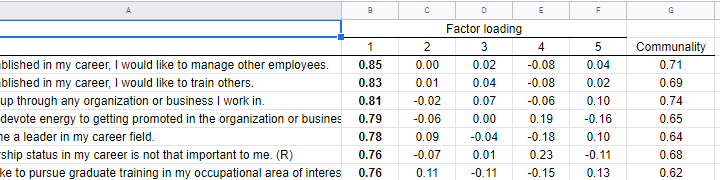
The figure below shows an APA style table combining factor loadings and communalities for our example analysis.
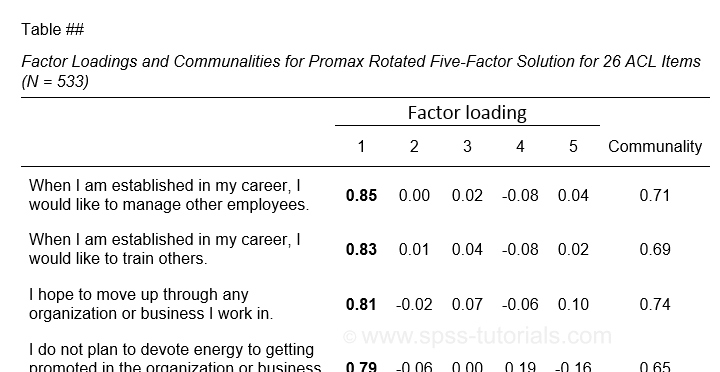 Example APA style factor loadings table
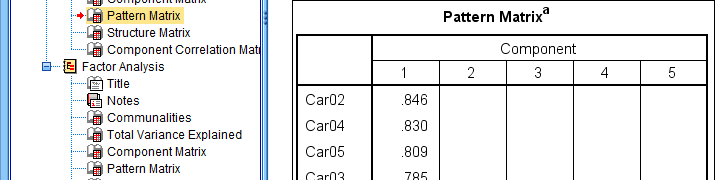
If you take a good look at the SPSS output, you'll see that you cannot simply copy-paste these tables for combining them in Excel. This is because the factor loadings (pattern matrix) table follows a different variable order than the communalities table. Since the latter follows the variable order as specified in your syntax, the easiest fix for this is to
- make sure that only variable names (not labels) are shown in the output;
- copy-paste the correctly sorted pattern matrix into Excel;
- copy-paste the variable names into the FACTOR syntax and rerun it.
Tip: try and replace the line breaks between variable names by spaces as shown below.
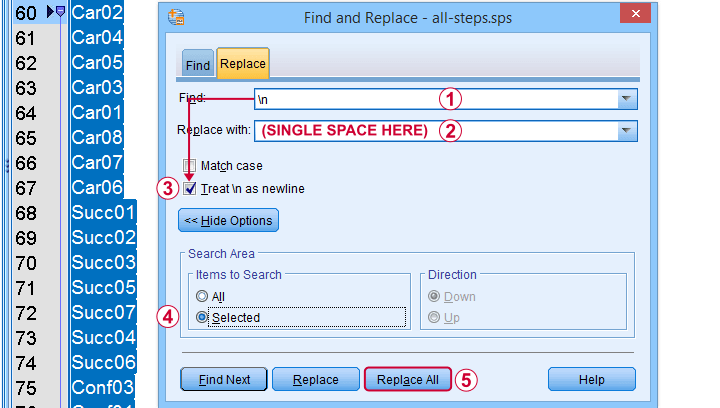 Replace line breaks by spaces in an SPSS syntax window
Also, you probably want to see only variable labels (not names) from now on. And -finally- we no longer want to hide any small absolute factor loadings shown below.
 This table is fine for an exploratory analysis but not for reporting
The syntax below does all that and thus creates output that is ideal for creating APA style tables.
set tvars labels.
*RERUN PREVIOUS ANALYSIS WITH VARIABLE ORDER AS IN PATTERN MATRIX TABLE.
FACTOR
/VARIABLES Car02 Car04 Car05 Car03 Car01 Car08 Car07 Car06 Succ01 Succ02 Succ03 Succ05 Succ07 Succ04 Succ06
Conf03 Conf01 Conf05 Conf02 Conf06 Tou02 Tou05 Tou01 Comp02 Comp03 Comp01
/MISSING PAIRWISE
/PRINT INITIAL EXTRACTION ROTATION
/FORMAT SORT
/CRITERIA FACTORS(5) ITERATE(25)
/EXTRACTION PC
/ROTATION PROMAX
/METHOD=CORRELATION.
You can now safely combine the communalities and pattern matrix tables and make some final adjustments. The end result is shown in this Googlesheet, partly shown below.
 An APA table for WORD is best created in a Googlesheet or Excel
Since decimal places, fonts, alignment and borders have all been set, this table is now perfect for its final copy-paste into WORD.
Table II - Total Variance Explained
The screenshot below shows how to report the Eigenvalues table in APA style.
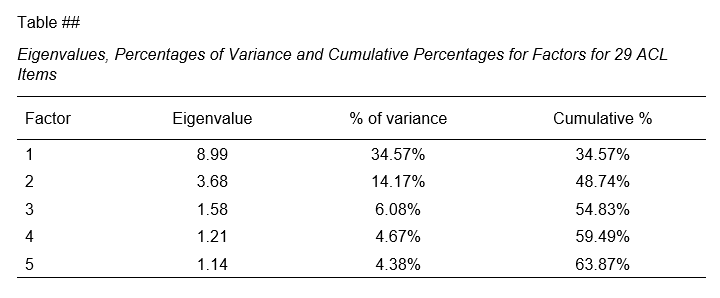 APA style Eigenvalues example table
The corresponding SPSS output table comes fairly close to this. However, an annoying problem are the missing percent signs.
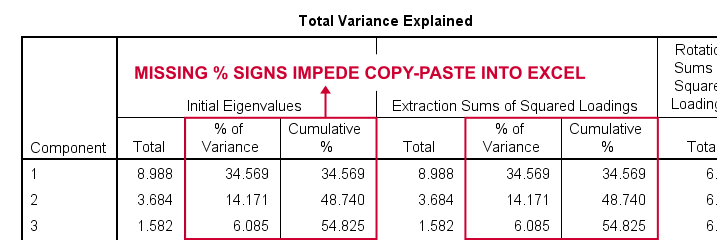
If we copy-paste into Excel and set a percentage format, 34.57 is converted into 3,457%. This is because Excel interprets these numbers as proportions rather than percentage points as SPSS does. The easiest fix is setting a percent format for these columns in SPSS before copy-pasting into Excel.
The OUTPUT MODIFY example below does just that for all Eigenvalues tables in the output window.
output modify
/select tables
/tablecells select = ["% of Variance"] format = 'pct6.2'
/tablecells select = ["Cumulative %"] format = 'pct6.2'.
After this tiny fix, you can copy-paste this table from SPSS into Excel. We can now easily make some final adjustments (including the removal of some rows and columns) and copy-paste this table into WORD.
Table III - Factor Correlations
If you used an oblique factor rotation, you'll probably want to report the correlations among your factors. The figure below shows an APA style factor correlations table.
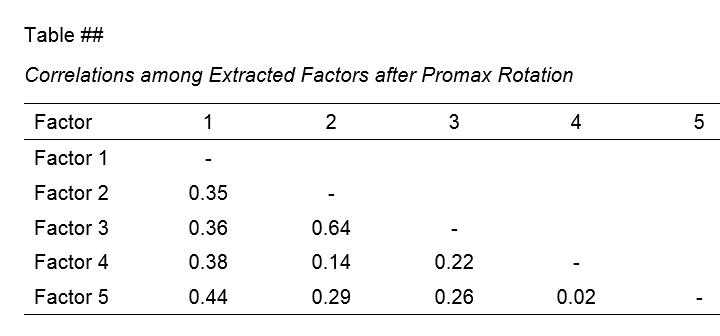
The corresponding SPSS output table (shown below) is pretty different from what we need.
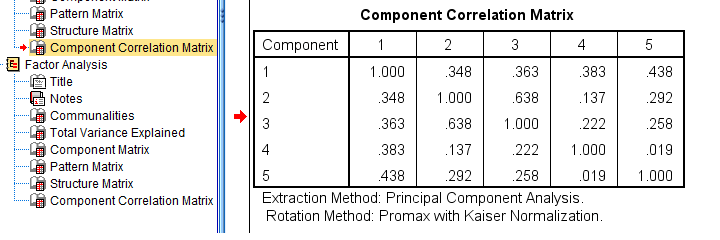 APA style factor correlation table
Adjusting this table manually is pretty doable. However, I personally prefer to use an SPSS Python script for doing so.
You can download my script from LAST-FACTOR-CORRELATION-TABLE-TO-APA.sps. This script is best run from an INSERT command as shown below.
insert file = 'D:\DOWNLOADS\LAST-FACTOR-CORRELATION-TABLE-TO-APA.sps'.
I highly recommend trying this script but it does make some assumptions:
- the above syntax assumes the script is located in D:\DOWNLOADS so you probably need to change that;
- the script assumes that you've the SPSS Python3.x essentials properly installed (usually the case for recent SPSS versions);
- the script assumes that no SPLIT FILE is in effect.
If you've any trouble or requests regarding my script, feel free to contact me and I'll see what I can do.
Final Notes
Right, so these are the basic routines I follow for creating APA style factor analysis tables. I hope you'll find them helpful.
If you've any feedback, please throw me a comment below.
Thanks for reading!