- SPSS Factor Analysis Dialogs
- Output I - Total Variance Explained
- Output II - Rotated Component Matrix
- So What is a Varimax Rotation?
- Promax Rotation Reduces Cross-Loadings
- Excluding Items from Factor Analysis
Which personality traits predict career ambitions? A study was conducted to answer just that. The data -partly shown below- are in 20-career-ambitions-pca.sav.
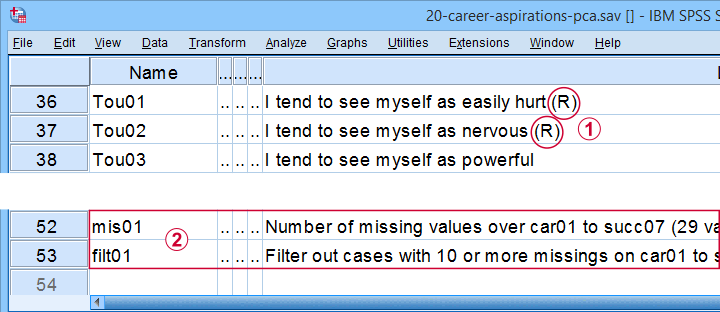
Variables Car01 (short for “career ambitions”) through Succ07 (short for “successfulness”) attempt to measure 5 traits. These variables have already been prepared for analysis:
 some negative statements were reverse coded and therefore had “(R)” appended to their variable labels;
 mis01 contains the number of missing values for each respondent. We created filt01 which filters out any respondents having 10 or more missing values (out of 29 variables).
The first research questions we'd now like to answer are
- do these 29 statements indeed measure 5 underlying traits or “factors”
- precisely which statements measure which factors?
A factor analysis will answer precisely those questions. But let's first activate our filter variable by running the syntax below.
filter by filt01.
*Inspect missing values per respondent.
frequencies mis01.
Result
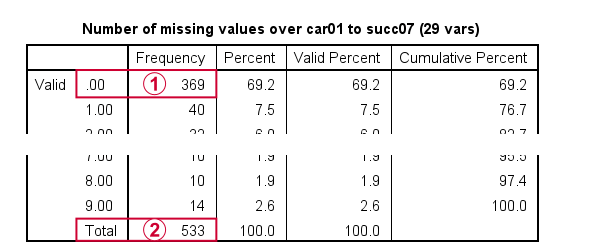
Note that only 369 out of N = 575 cases have zero missing values on all 29 variables.
With our FILTER in effect, all analyses will be limited to N = 533 cases having 9 or fewer missing values. Now, as a rule of thumb,
we'd like to use at least 15 cases for each variable
in a factor analysis.
So for our example analysis we'd like to use at least 29 (variables) * 15 = 435 cases. This is one reason for including some incomplete respondents. Another is that a larger sample size results in more statistical power and smaller confidence intervals.
Right. We're now good to go so let's proceed with our actual factor analysis.
SPSS Factor Analysis Dialogs
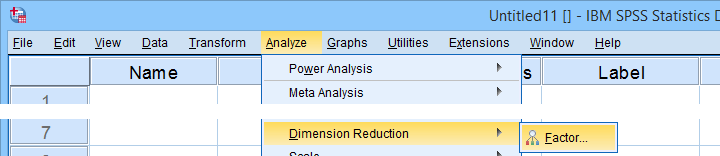
Let's first open the factor analysis dialogs from
![]()
![]() as shown below.
as shown below.
For our first analysis, most default settings will do. However, we do want to adjust some settings under Rotation and Options.
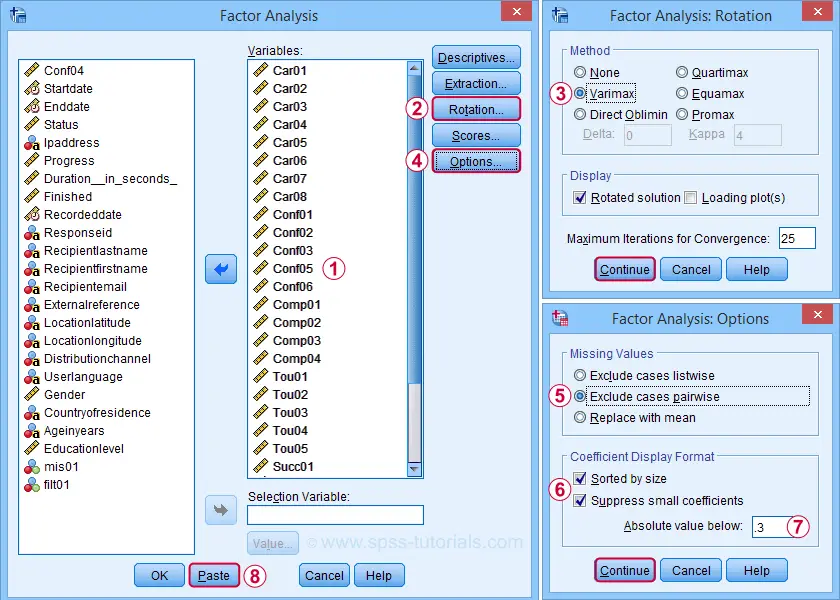
 We'll exclude cases with missing values pairwise. Listwise exclusion limits our analysis to N = 369 complete cases which is (arguably) insufficient sample size for 29 variables.
Completing these steps results in the syntax below.
SPSS FACTOR Syntax I - Basic Settings
FACTOR
/VARIABLES Car01 Car02 Car03 Car04 Car05 Car06 Car07 Car08 Conf01 Conf02 Conf03 Conf05 Conf06
Comp01 Comp02 Comp03 Comp04 Tou01 Tou02 Tou03 Tou04 Tou05 Succ01 Succ02 Succ03 Succ04 Succ05 Succ06
Succ07
/MISSING PAIRWISE
/ANALYSIS Car01 Car02 Car03 Car04 Car05 Car06 Car07 Car08 Conf01 Conf02 Conf03 Conf05 Conf06
Comp01 Comp02 Comp03 Comp04 Tou01 Tou02 Tou03 Tou04 Tou05 Succ01 Succ02 Succ03 Succ04 Succ05 Succ06
Succ07
/PRINT INITIAL EXTRACTION ROTATION
/FORMAT SORT BLANK(.3)
/CRITERIA MINEIGEN(1) ITERATE(25)
/EXTRACTION PC
/CRITERIA ITERATE(25)
/ROTATION VARIMAX
/METHOD=CORRELATION.
In this syntax, the ANALYSIS and second CRITERIA subcommands are redundant. Removing them keeps the syntax tidy and makes it easier to copy-paste-edit it for subsequent analyses. I therefore prefer to use the shortened syntax below.
FACTOR
/VARIABLES Car01 Car02 Car03 Car04 Car05 Car06 Car07 Car08 Conf01 Conf02 Conf03 Conf05 Conf06
Comp01 Comp02 Comp03 Comp04 Tou01 Tou02 Tou03 Tou04 Tou05 Succ01 Succ02 Succ03 Succ04 Succ05 Succ06
Succ07
/MISSING PAIRWISE
/PRINT INITIAL EXTRACTION ROTATION
/FORMAT SORT BLANK(.3)
/CRITERIA MINEIGEN(1) ITERATE(25)
/EXTRACTION PC
/ROTATION VARIMAX
/METHOD=CORRELATION.
SPSS FACTOR Output I - Total Variance Explained
After running our first factor analysis, let's first inspect the Total Variance Explained Table (shown below).
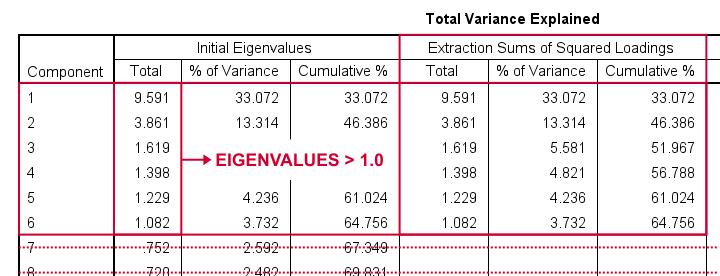
This table tells us that
- SPSS has created 29 artificial variables known as components.
- These components aim to represent personality traits underlying our analysis variables (“items”).
- If a component reflects a real trait, it should correlate substantially with these items. Or put differently: it should account for a reasonable percentage of variance.
- Like so, component 1 accounts for 33.07% of the variance in our 29 items or an equivalent of 9.59 items. This number is known as an eigenvalue.
- You could thus think of eigenvalues as “quality scores” for the components: higher eigenvalues provide stronger evidence that components represent real underlying traits. Now, the big question is:
which components have sufficient eigenvalues
to be considered real traits?
By default, SPSS uses a cutoff value of 1.0 for eigenvalues. This is because the average eigenvalue is always 1.0 if you analyze correlations. Therefore, this rule of thumb is completely arbitrary: there's no real reason why 1.0 should be better cutoff value than 0.8 or 1.2.
In any case, SPSS suggests that our 29 items may measure 6 underlying traits. We'd now like to know which items measure which traits. For answering this, we inspect the Rotated Component Matrix shown below.
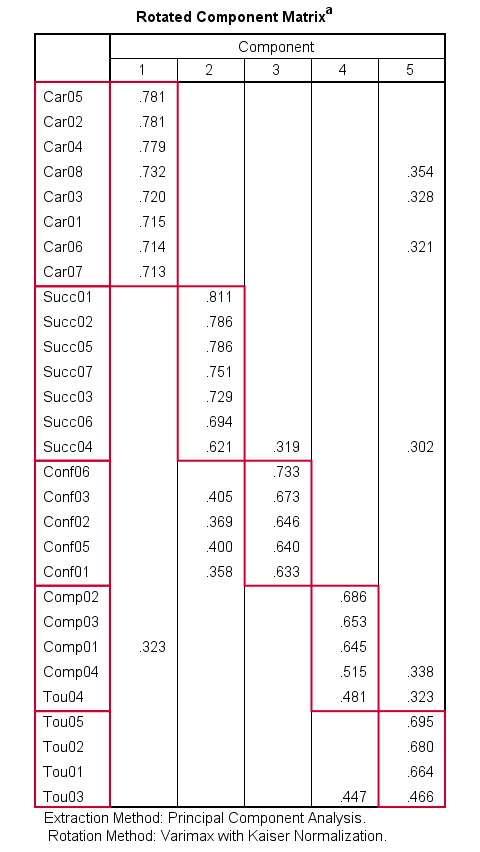
SPSS FACTOR Output II - Rotated Component Matrix
The Rotated Component Matrix contains the Pearson correlations between items and components or “factors”. These are known as factor loadings and allow us to interpret which traits our components may reflect.
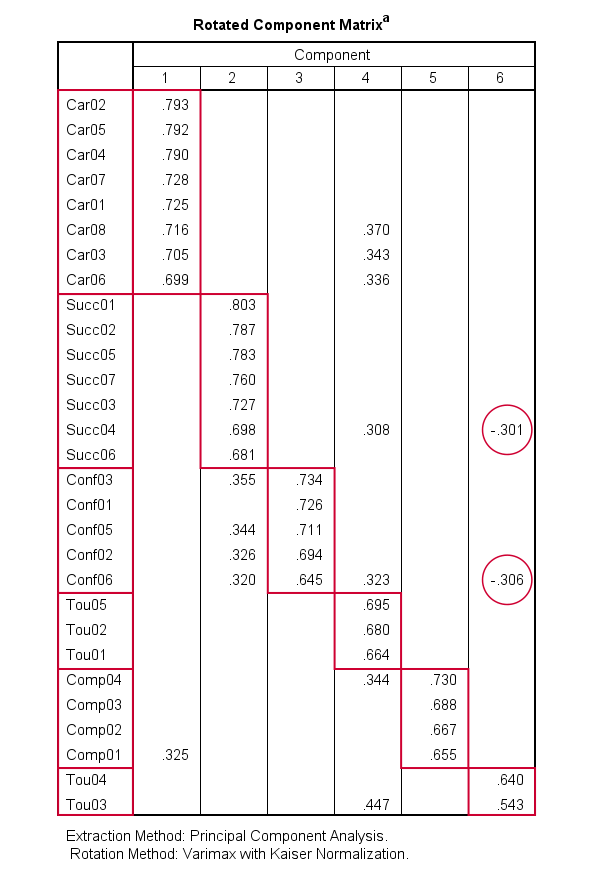
- Component 1 correlates strongly with Car02, Car05,..., Car06. If we inspect the variable labels of these variables, we see that the “Car” items all relate to career ambitions. Therefore, component 1 seems to reflect some kind of career ambition trait.
- Component 2 correlates mostly with the “Succ” items. Their variable labels tell us that these items relate to successfulness.
- In a similar vein, Component 3 correlates most with the self confidence items Conf01 to Conf05.
- Component 4 seems to measure toughness.
- Component 5 may reflect a competitiveness trait.
- Component 6 correlates somewhat positively with 2 toughness items but somewhat negatively with a successfulness and confidence item. As none of these loadings are very strong, component 6 is not easily interpretable.
These results suggest that perhaps only components 1-5 reflect real underlying traits. Now, the table we just inspected shows the factor loadings after a varimax rotation of our 6 components (or “factors”).
So What is a Varimax Rotation?
Very basically,
a factor rotation is a mathematical procedure that
redistributes factor loadings over factors.
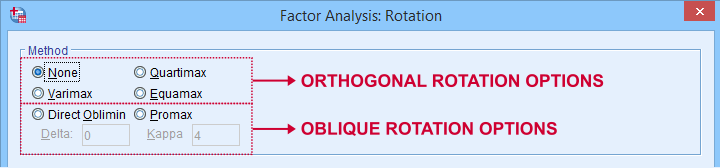
The reason for doing this is that this makes our factors easier to interpret: rotation typically causes each item to load highly on precisely one factor. There's different factor rotation methods but all of them fall into 2 basic types:
- an orthogonal rotation does not allow any factors to correlate with each other. An example is the varimax rotation.
- an oblique rotation allows all factors to correlate with each other. Examples are the promax and oblimin rotations.
Now, factor rotation also redistributes the percentages of variance accounted for by different factors. The new percentages are shown below under Rotation Sums of Squared Loadings.
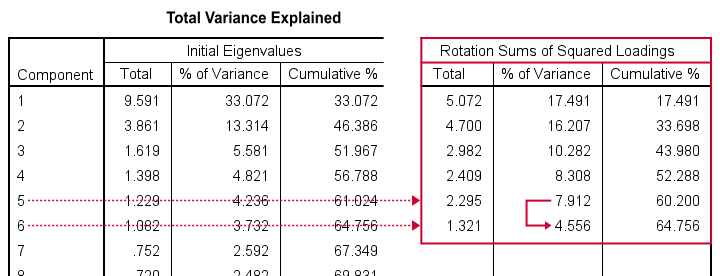
What's striking here, is the huge drop from component 5 (7.91%) to component 6 (4.56%). This provides further evidence that our items perhaps measure 5 rather than 6 underlying factors.
We'll therefore rerun our analysis and force SPSS to extract and rotate 5 instead of 6 factors. We'll do so by copy-pasting our first syntax and replacing MINEIGEN(1) by FACTORS(5).
SPSS FACTOR Syntax II - Force 5 Factor Solution
FACTOR
/VARIABLES Car01 Car02 Car03 Car04 Car05 Car06 Car07 Car08 Conf01 Conf02 Conf03 Conf05 Conf06
Comp01 Comp02 Comp03 Comp04 Tou01 Tou02 Tou03 Tou04 Tou05 Succ01 Succ02 Succ03 Succ04 Succ05 Succ06
Succ07
/MISSING PAIRWISE
/PRINT INITIAL EXTRACTION ROTATION
/FORMAT SORT BLANK(.3)
/CRITERIA FACTORS(5) ITERATE(25)
/EXTRACTION PC
/ROTATION VARIMAX
/METHOD=CORRELATION.
Result
Our rotated component matrix looks much better now: each component is interpretable and has some strong positive factor loadings. The negative loadings are all gone.
Promax Rotation Reduces Cross-Loadings
A problem with this solution, though, is that many items load on 2 or more factors simultaneously. Such secondary loadings are known as cross-loadings and conflict with the basic factor model as shown below.
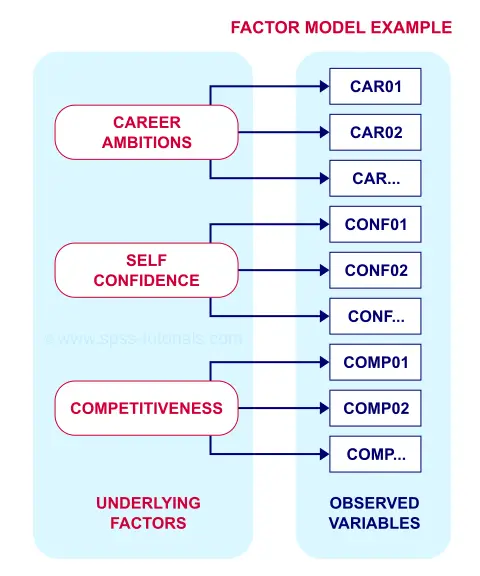
Each item measures only one trait and should thus load substantially on only one factor. Also note that there's no arrows among the underlying factors: the model claims that
career ambitions, self confidence and competitiveness
are all perfectly uncorrelated.
Does anybody think that's realistic for real-world data? I sure don't. Of course such traits are correlated substantially. However, our varimax rotation does not allow our factors to correlate. And therefore, these correlations express themselves as cross-loadings.
With most data, cross-loadings disappear when we allow our factors to correlate. We'll do just that by using an oblique factor rotation such as promax.
SPSS FACTOR Syntax III - Promax Rotation
FACTOR
/VARIABLES Car01 Car02 Car03 Car04 Car05 Car06 Car07 Car08 Conf01 Conf02 Conf03 Conf05 Conf06
Comp01 Comp02 Comp03 Comp04 Tou01 Tou02 Tou03 Tou04 Tou05 Succ01 Succ02 Succ03 Succ04 Succ05 Succ06
Succ07
/MISSING PAIRWISE
/PRINT INITIAL EXTRACTION ROTATION
/FORMAT SORT BLANK(.3)
/CRITERIA FACTORS(5) ITERATE(25)
/EXTRACTION PC
/ROTATION PROMAX
/METHOD=CORRELATION.
Result
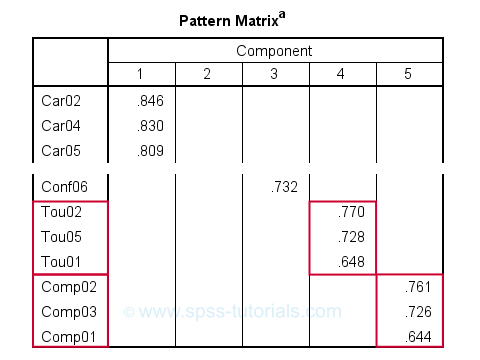
When using an oblique rotation, we usually inspect the Pattern Matrix for interpreting our components.
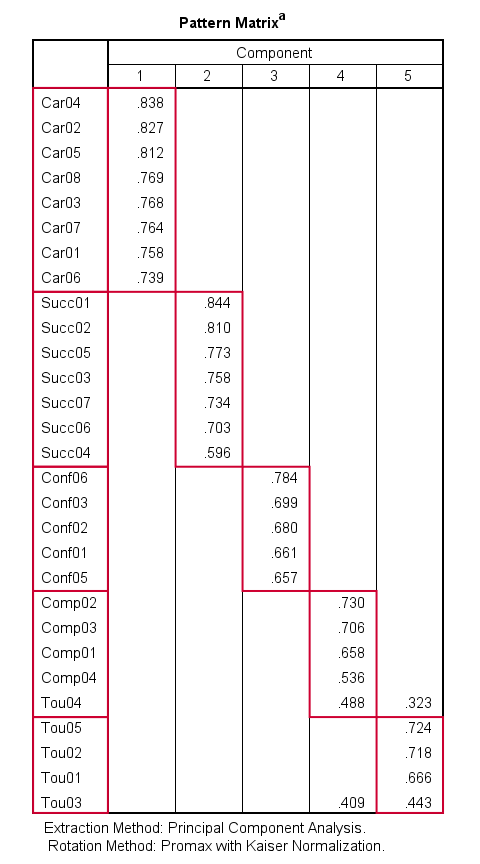
Our pattern matrix looks great! Almost all cross-loadings have gone. But where did they go? Well, correlations among factors have taken over their role. This typically happens during an oblique rotation. These correlations are shown in the Component Correlation Matrix, the last table in our output.
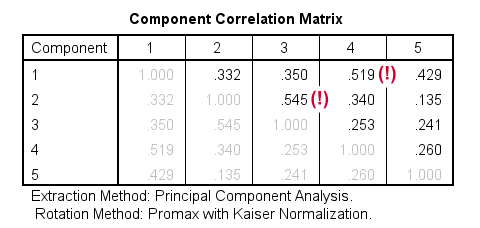
Most correlations indicate medium or even strong effect sizes. I think that's perfectly realistic: our components reflect traits such as successfulness and self confidence and these are obviously strongly correlated in the real world.
Personally, I'd settle for the variable grouping proposed by this analysis. A good next step is inspecting Cronbach’s alphas for our 5 subscales. Finally, we'd create subscale scores in our data by computing means over these variables and perhaps proceed with a regression analysis.
Excluding Items from Factor Analysis
Most textbooks propose that you now exclude items with cross-loadings from the analysis. For our analysis, SPSS shows absolute loadings < 0.3 as blanks. This cutoff value -although completely arbitrary- seems a reasonable threshold for separating negligible from substantial loadings.
Anyway, if you decide to exclude items, the right way to do so is to
- look up the variable having the highest cross-loading;
- remove its variable name from the FACTOR syntax;
- rerun the factor analysis -note that all loadings now change;
- repeat these steps if necessary and keep track of what you're doing.
For our example analysis, these steps result in the syntax below.
FACTOR
/VARIABLES Car01 Car02 Car03 Car04 Car05 Car06 Car07 Car08 Conf01 Conf02 Conf03 Conf05 Conf06
Comp01 Comp02 Comp03 Comp04 Tou01 Tou02 Tou04 Tou05 Succ01 Succ02 Succ03 Succ04 Succ05 Succ06
Succ07
/MISSING PAIRWISE
/PRINT INITIAL EXTRACTION ROTATION
/FORMAT SORT BLANK(.3)
/CRITERIA FACTORS(5) ITERATE(25)
/EXTRACTION PC
/ROTATION PROMAX
/METHOD=CORRELATION.
*PCA V - AS PREVIOUS BUT REMOVE COMP04.
FACTOR
/VARIABLES Car01 Car02 Car03 Car04 Car05 Car06 Car07 Car08 Conf01 Conf02 Conf03 Conf05 Conf06
Comp01 Comp02 Comp03 Tou01 Tou02 Tou04 Tou05 Succ01 Succ02 Succ03 Succ04 Succ05 Succ06
Succ07
/MISSING PAIRWISE
/PRINT INITIAL EXTRACTION ROTATION
/FORMAT SORT BLANK(.3)
/CRITERIA FACTORS(5) ITERATE(25)
/EXTRACTION PC
/ROTATION PROMAX
/METHOD=CORRELATION.
*PCA VI - AS PREVIOUS BUT REMOVE TOU04.
FACTOR
/VARIABLES Car01 Car02 Car03 Car04 Car05 Car06 Car07 Car08 Conf01 Conf02 Conf03 Conf05 Conf06
Comp01 Comp02 Comp03 Tou01 Tou02 Tou05 Succ01 Succ02 Succ03 Succ04 Succ05 Succ06
Succ07
/MISSING PAIRWISE
/PRINT INITIAL EXTRACTION ROTATION
/FORMAT SORT BLANK(.3)
/CRITERIA FACTORS(5) ITERATE(25)
/EXTRACTION PC
/ROTATION PROMAX
/METHOD=CORRELATION.
Result
After removing 3 items with cross-loadings, it seems we've a perfectly clean factor structure: each item seems to load on precisely one factor. Keep in mind, however, that we chose to suppress absolute loadings < 0.30. Those are not shown but they still exist.
Right, I guess that'll do for today. I hope you found this tutorial helpful. And last but not least,
Thanks for reading!
THIS TUTORIAL HAS 9 COMMENTS:
By Carsten Ulstrup on December 21st, 2022
Hi
It seems to me, that you are doing a principal component analysis and not a factor analysis. The theory and interpretation is not the same.
By Ramakrishnan on December 26th, 2022
Very nice and useful. Structure is first step for confirmatory factor analysis. This will be useful to proceed further.
By Edwin from Ghana on October 6th, 2024
Please I will like to get the write up in pdf form. Please kindly send to my email. very great write up
By Ruben Geert van den Berg on October 7th, 2024
Hi Edwin!
We don't have any .pdf or WORD versions of our tutorials.
However, you can print it as .pdf from your web browser.
Hope that helps!
SPSS tutorials