Running some basic descriptive statistics in SPSS is super easy with the DESCRIPTIVES command. However, the resulting table doesn't even come close to the APA required format or what corporate clients often demand.
So what's the problem? Well, you'll quickly find out if you
try and create the table shown below.
 Nice and clean APA descriptives table.
SPSS DESCRIPTIVES Example
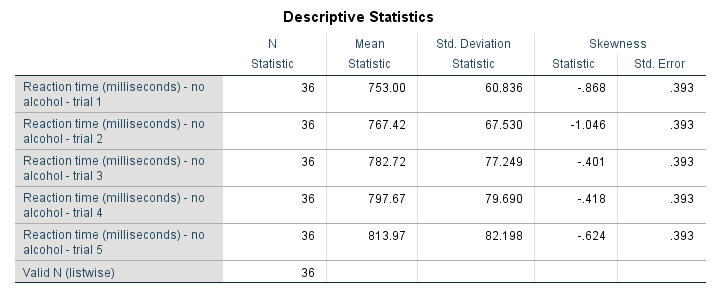
This table is based on no_1 to no_5 in alcotest.sav. When trying to create it with DESCRIPTIVES, the closest I got was the syntax below.
/statistics means stddev skewness.
Result

Although this table is very easy to create -and does a good job when exploring data- it's not quite what it should have been. So let's dive into some issues.
No Median in DESCRIPTIVES
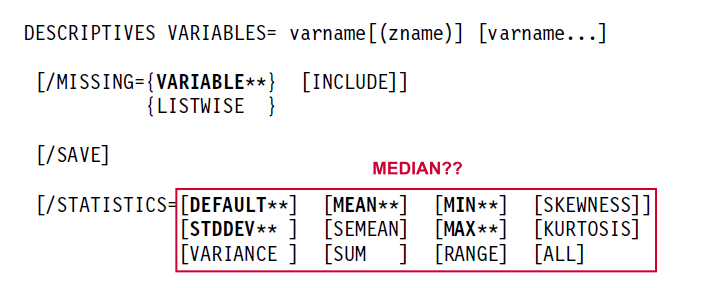
For some weird reason, DESCRIPTIVES does not include the median. Seriously, I looked it up in the CSR and it's just not there.

Ok, then let's just skip the median for now and run into the second problem.
Undesired Inferential Statistics
For some statistics -including skewness and kurtosis- SPSS will automatically report their standard errors. But: if I want standard errors, I'll ask for them.

If I don't ask for them, then I probably don't want them. But I get them anyway. And I've several problems with that:
- The standard errors result in a complicated table format with merged cells. Removing or hiding these unwanted cells is complicated. At least, I haven't found a quick and easy way for doing so.
- Standard errors are not descriptive but -rather- inferential statistics. They are only correct if my data are a simple random sample from my population.
- If my data hold a substantive percentage of my population, these standard errors are biased (away from zero).In this case, I need to apply a so-called finity correction to the standard errors. The SPSS complex samples option (module) is needed to do so.
- If I sampled my entire population, the reported standard errors are nonsensical. In this case, there's no sampling error so the correct standard errors are all zero.
Undesired N Column
When I'm just exploring my data, I like to see the N per variable. It tells me how many missing values each variable has. But if I don't have any missings, I don't want this column. In this case, I rather report N in the title of my table. However, I can't omit N when using DESCRIPTIVES.
Can't Omit “Valid N (listwise)”
In a similar vein, DESCRIPTIVES always includes Valid N (listwise). This tells me how many cases have zero missing values on all variables included in my table. When preparing data -especially for a multivariate analysis- that's great. However,
“Valid N (listwise)” puzzles my non SPSS using clients
and they don't want to see it. Fortunately, an SPSS Python script does a fair job hiding it. Still, being able to choose whether to include it or not would be highly preferable over always including it and then having to hide it.
A similar point was made in SPSS Correlations in APA Format.
CELLS or STATISTICS?
- When running CROSSTABS, the CELLS subcommand specifies which cells my contingency table should hold.
Next, a test for statistical significance -usually a chi-square independence test- can be specified with STATISTICS.STATISTICS in CROSSTABS also creates several correlations such as Pearson correlations, Cramér’s V, Spearman rank correlations and many other statistics. - When running MEANS, the CELLS subcommand specifies which cells my means table should hold.
Next, a test for statistical significance -a one-way ANOVA- can be specified with STATISTICS. - When running DESCRIPTIVES, there's no CELLS subcommand.
STATISTICS specifies which cells my descriptives table should hold.
Table Styling
If you're on SPSS version 22 or earlier, your descriptives table probably looks like the one shown below. Not super pretty but clean and decent.

For some reason, SPSS 23 introduced new table styles with grey text on -again- grey backgrounds. I don't like the way they look on screen, let alone when printed out.
If you like the old styles more than the new ones, you can revert to them by setting Original.stt as your tablelook. On my system,
set tlook "C:\Program Files\IBM\SPSS\Statistics\24\Looks\Original.stt".
does the trick.
Nicer Descriptives with MEANS

So how to create this descriptives table in APA format? Well, it's utterly simple. Just run
means no_1 to no_5
/cells mean stddev median skew.
and transpose the resulting table. Which leaves us with one question: how to transpose a table in SPSS?
Transposing Pivot Tables in SPSS
In contrast to chart templates, table templates can't transpose output for you -which is unfortunate because it would save a lot of time. So there's 3 options:
- Manually: right-click the table, select
 and rearrange the pivoting trays. For an example, see SPSS Chi-Square Independence Test (scroll way down).
 - Python: an SPSS Python script can transpose one, many or all pivot tables in your output window for you. This requires you have the SPSS Python Essentials properly installed.
- Last but not least, if you're on SPSS 22 or higher, OUTPUT MODIFY does the trick fast with little syntax. I'll add an example below.
OUTPUT MODIFY
/SELECT TABLES
/IF commands = ["means"] subtypes =["report"]
/TABLE TRANSPOSE=YES.
Thanks for reading.
 SPSS TUTORIALS
THIS TUTORIAL HAS 3 COMMENTS:
By Sumera on April 26th, 2022
Excellent guidance
By Naomi Penny on August 6th, 2022
Thanks for the tips! When would you advise reporting Skewness and Kurtosis?
By Ruben Geert van den Berg on August 7th, 2022
That's a very multifaceted question.
Purely technically, I'd love to see histograms for a small number of variables.
If that takes up too much space, I'd like a detailed table with statistics (including the medians too).
However, in academic environments, you're often expected to limit yourself to means and SD's.
So I don't have a short and simple answer...