- Kurtosis Examples
- Kurtosis Formulas
- Kurtosis or Excess Kurtosis?
- Kurtosis Calculation Example
- Platykurtic, Mesokurtic and Leptokurtic
In statistics, kurtosis refers to the “peakedness”
of the distribution for a quantitative variable.
What's meant by “peakedness” is best understood from the example histograms shown below.
Kurtosis Examples
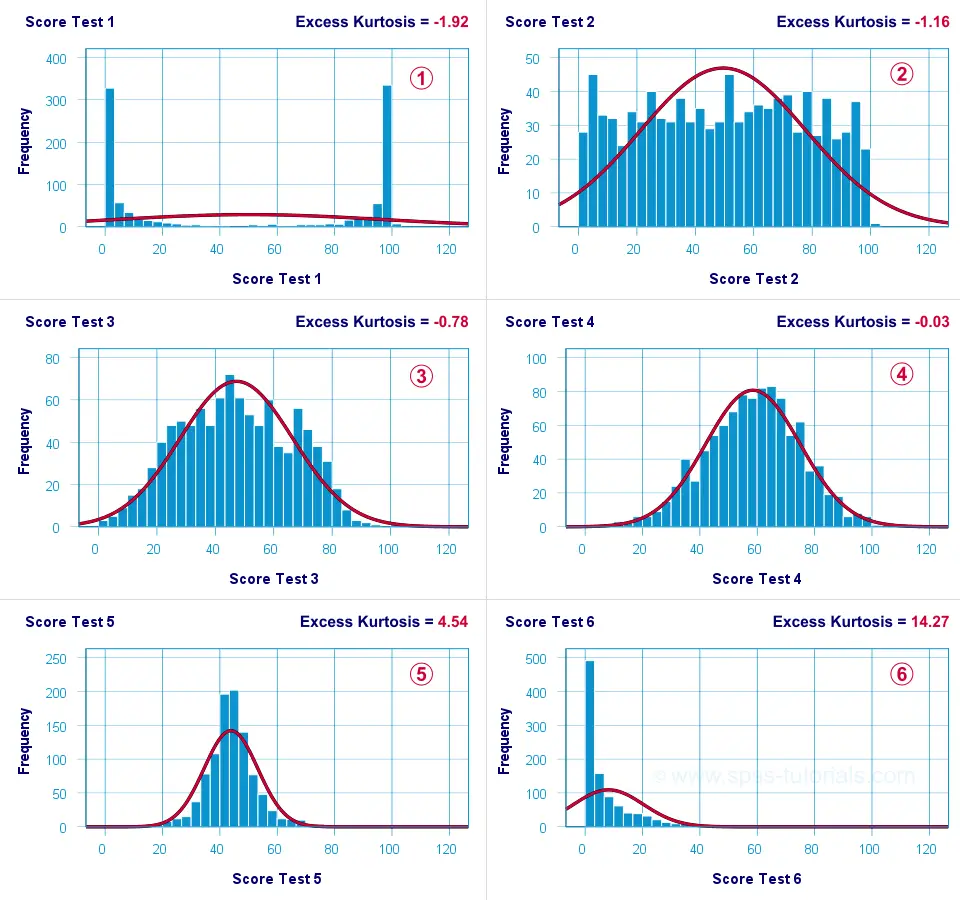
 Test 4 is almost perfectly normally distributed. Its excess kurtosis is therefore close to 0.
 The distribution for test 3 is somewhat “flatter” than the normal curve: the histogram bars are lower than the middle of the curve and higher towards its tails. Test 3 therefore has a negative excess kurtosis.
 Test 5 is more “peaked” than the normal curve: its bars are higher than the peak of the curve and lower towards its tails. Therefore, test 5 has a positive excess kurtosis.
 Test 2 roughly follows a uniform distribution. Because it's even flatter than test 3, it has a stronger negative excess kurtosis.
 The strongest negative excess kurtosis is seen for test 1, which has a bimodal distribution.
 Positive excess kurtosis is often seen for variables having strong (positive) skewness such as test 6.
So now that we've an idea what (excess) kurtosis means, let's see how it's computed.
Kurtosis Formulas
If your data contain an entire population rather than just a sample, the population kurtosis \(K_p\) is computed as
$$K_p = \frac{M_4}{M_2^2}$$
where \(M_2\) and \(M_4\) denote the second and fourth moments around the mean:
$$M_2 = \frac{\sum\limits_{i = 1}^N(X_i - \overline{X})^2}{N}$$
and
$$M_4 = \frac{\sum\limits_{i = 1}^N(X_i - \overline{X})^4}{N}$$
Note that \(M_2\) is simply the population-variance formula.
Kurtosis or Excess Kurtosis?
A normally distributed variable has a kurtosis of 3.0. Since this is undesirable, population excess kurtosis \(EK_p\) is defined as
$$EK_p = K_p - 3$$
so that excess kurtosis is 0.0 for a normally distributed variable.
Now, that's all fine. But what's not fine is that “kurtosis” refers to either kurtosis or excess kurtosis in standard textbooks and software packages without clarifying which of these two is reported.
Anyway.
Our formulas thus far only apply to data containing an entire population. If your data only contain a sample from some population -usually the case- then you'll want to compute sample excess kurtosis \(EK_s\) as
$$EK_s = ((N + 1) \cdot EK_p + 6) \cdot \frac{(N - 1)}{(N - 2) \cdot (N - 3)}$$
This formula results in “kurtosis” as reported by most software packages such as SPSS, Excel and Googlesheets. Finally, most text books suggest that the standard error for (excess) kurtosis \(SE_{eks}\) is computed as
$$SE_{eks} \approx \sqrt{\frac{24}{N}}$$
This approximation, however, is not accurate for small sample sizes. Therefore, software packages use a more complicated formula. I won't bother you with it.
Kurtosis Calculation Example
An example calculation for excess kurtosis is shown in this Googlesheet (read-only), partly shown below.
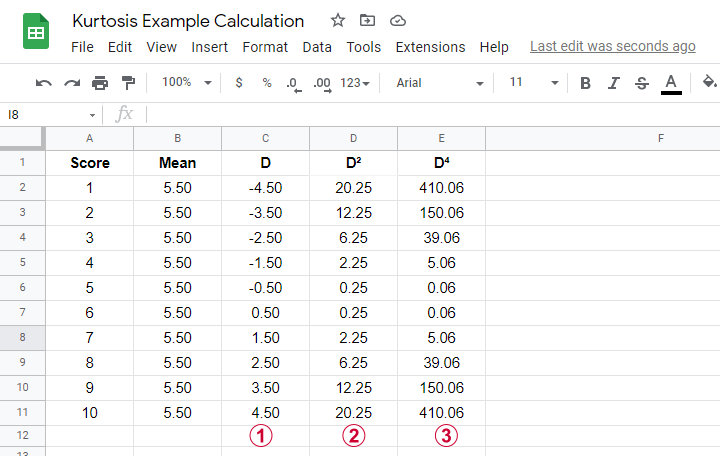
We computed excess kurtosis for scores 1 through 10. First off, we added their mean, M = 5.50. Next,
\(D\) denotes the difference scores (score - mean);
\(D^2\) are squared difference scores that are used for computing a variance;
\(D^4\) are difference scores raised to the fourth power.
As shown below, the remaining computations are fairly simple too.
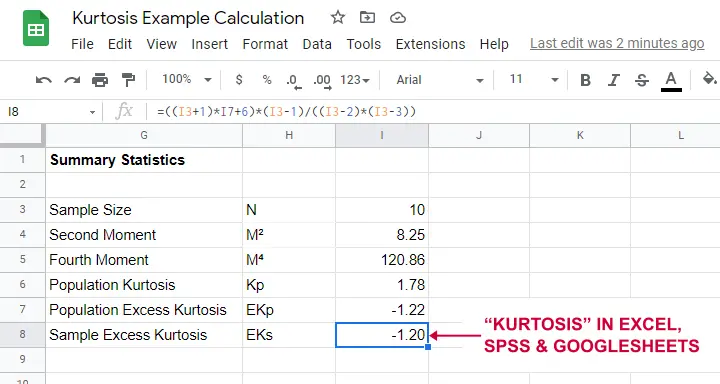
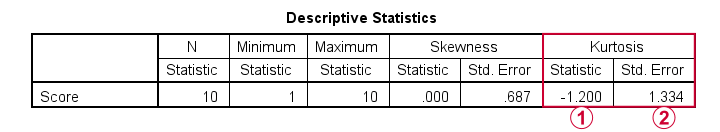
Note that the excess kurtosis = 1.20. The SPSS output shown below confirms this result.
Platykurtic, Mesokurtic & Leptokurtic
Some terminology related to excess kurtosis is that
- a variable having excess kurtosis < 0 is called platykurtic;
- a variable having excess kurtosis = 0 is called mesokurtic;
- a variable having excess kurtosis > 0 is called leptokurtic.
Our kurtosis examples illustrate what platykurtic, mesokurtic and leptokurtic distributions tend to look like.
Finding Kurtosis in Excel & SPSS
First off, “kurtosis” always refers to sample excess kurtosis in Excel, Googlesheets and SPSS. It's found in Excel and Googlesheets by using something like =KURT(A2:A11)
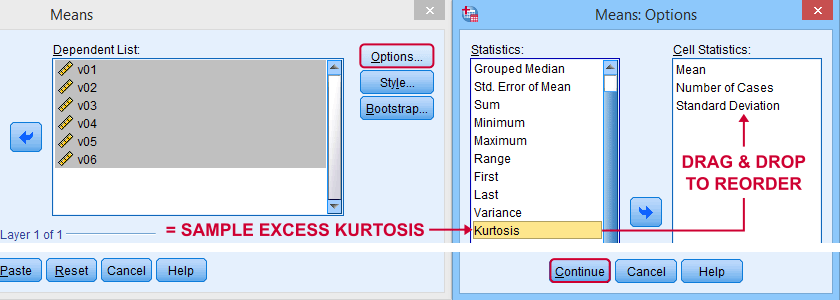
SPSS has many options for computing excess kurtosis but I personally prefer using
![]()
![]()
As shown below, kurtosis can be selected from Options and dragged into the desired position.
Right, I think that's about it regarding (excess) kurtosis. If you've any questions or remarks, please throw me a comment below. Other than that:
thanks for reading!
THIS TUTORIAL HAS 27 COMMENTS:
By N. Bowen on February 4th, 2025
Thank you for your response, Ruben. It is very helpful. Natasha
By Ruben Geert van den Berg on February 5th, 2025
Happy to hear that!
P.s. I'm planning a quick video on kurtosis in R studio which should make these points clear and simple in a couple of minutes with comparisons between R, SPSS and Excel. It's not as complicated as it seems at first.
If you follow us on LinkedIn, Facebook or YouTube, you'll see it come up in a couple of weeks.
Best regards,
Ruben
SPSS tutorials