The mode for some variable
is its value having the highest frequency.
- Mode for Continuous Variable
- Bimodal Distributions
- Finding Modes in SPSS
- Warning About Modes in Excel
Example
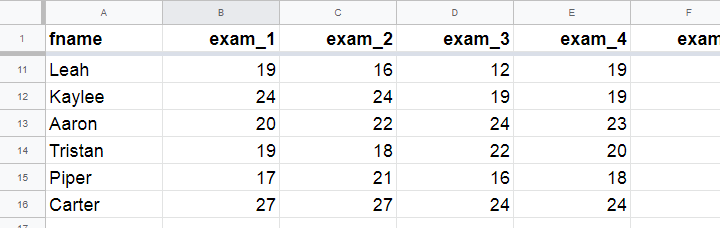
A class of 15 students take 8 exams over the academic year. The score for each exam is the number of correct answers. The data thus obtained are in this Googlesheet, partly shown below.
The bar chart shown below visualizes the frequency distribution for exam 1: for each score, it shows the number of students that obtained it. Scores that are absent -such as 25 and 26 points- didn't occur at all.
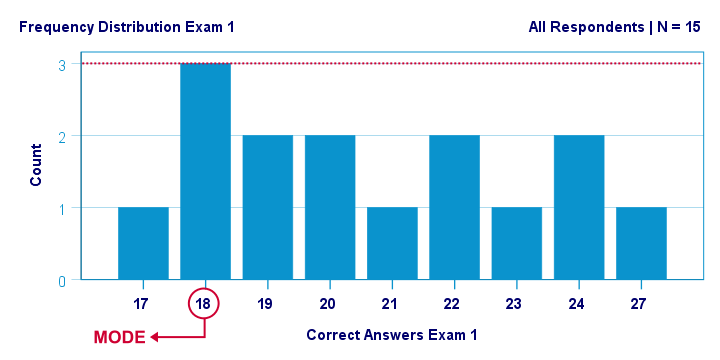
The mode for this variable is 18 points: it's the only value that occurs 3 times. All other scores occur just once or twice.
Mode for Continuous Variable
For continuous variables,
the mode usually refers to the range of values
having the highest frequency.
For example, we collected the body weights of N = 356 chickens in grams. The bar chart below shows the frequency distribution for this variable.
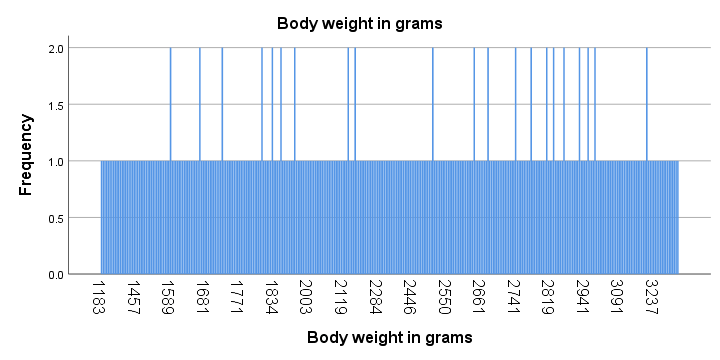
Strictly, this variable has some 15 modes and these are all weights in grams that occur twice. However, this doesn't give us any insight whatsoever. The problem is that almost every chicken has a different exact weight in grams.
The solution for this problem is inspecting fixed-width weight ranges instead of exact weights. The frequencies for these are shown in the histogram below.
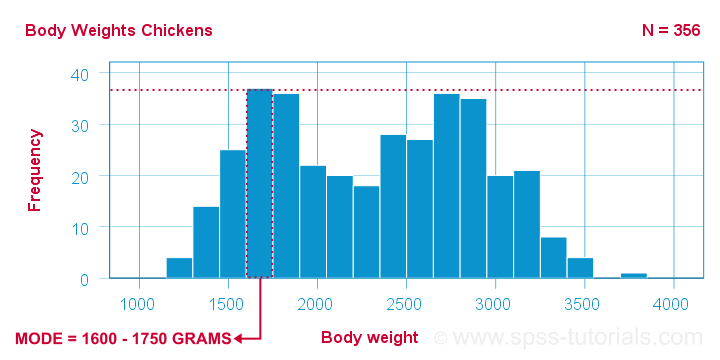
We chose a bin width of 150 grams for this chart. By doing so, the mode is the weight range from 1600 up to 1750 grams, which is observed for some 37 chickens.
Keep in mind here that the bin width is arbitrary: we could choose a different bin width and this would result in a different mode.
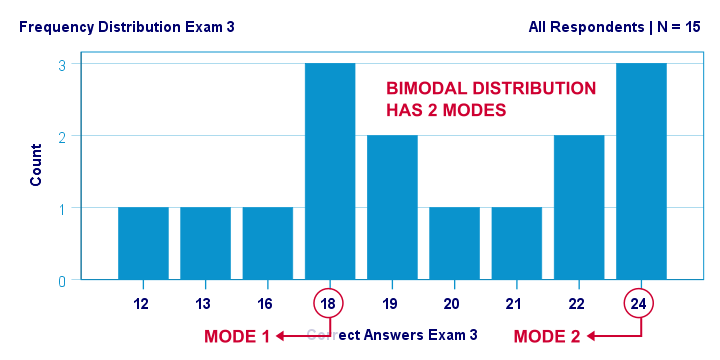
Bimodal Distributions
A bimodal distribution is a frequency distribution having 2 modes. An example is exam 3 in this Googlesheet, whose frequency distribution is shown below. Both 18 and 24 points occur 3 times. All other scores have lower frequencies.
For continuous variables,
a bimodal distribution refers to a frequency distribution
having 2 “clear peaks” that are not necessarily equally high. Most analysts would agree that the chicken histogram we saw earlier clearly shows a bimodal distribution. In many cases, however, what constitute “clear peaks” is rather subjective and also depends on the bin width chosen.
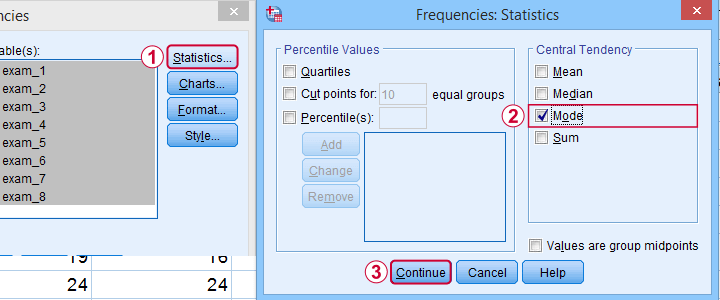
Finding Modes in SPSS
You can find modes in SPSS from
![]()
![]() as shown below. Use exams.sav if you'd like to give it a go.
as shown below. Use exams.sav if you'd like to give it a go.
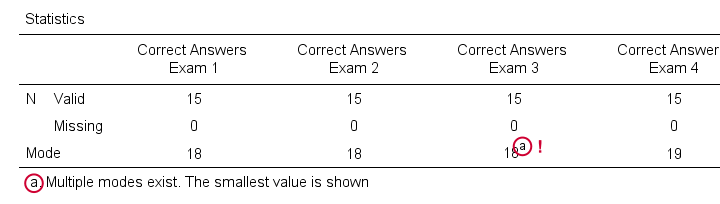
What's nice about the output -shown below- is that SPSS warns you if a variable has more than one mode. If any variables have multiple modes, the quickest way to find these is running bar charts over those variables.
Warning About Modes in Excel
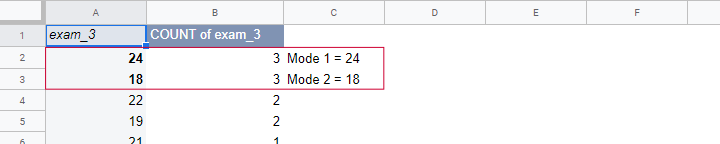
For finding modes in Excel, OpenOffice and Googlesheets, type something like =MODE(A2:A16) into some cell and specify the correct range of cells over which you'd like to find the mode. This works fine if a variable has only a single mode. However, Excel does not warn you if there's multiple modes and neither do the other spreadsheet editors. So how do you know if a variable has multiple modes? Sadly, the least clumsy approach is probably creating a sorted frequency table as shown below. The need for this tedious method renders the MODE function completely worthless.
Fortunately, both SPSS and JASP do warn about multiple modes. This allows you to inspect one or many variables in a single table -an easy and fast approach.
Thanks for reading!
THIS TUTORIAL HAS 2 COMMENTS:
By Sayra Jitendra yadav on June 25th, 2020
Good stuff and very helpful!
By Ruben Geert van den Berg on June 25th, 2020
Thanks for the compliment! Happy to hear you liked it!