Introduction & Practice Data File
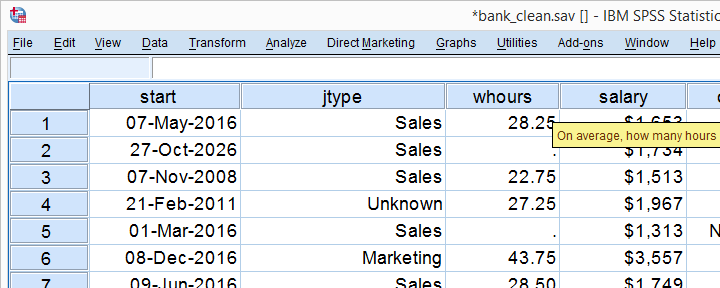
Among the very best SPSS practices is running histograms over your quantitative variables. Doing so is a super fast way to detect problems such as extreme values and gain a lot of insight into your data. This tutorial quickly walks you through using bank-clean.sav, part of which is shown below.
Option 1: FREQUENCIES without Frequency Tables
If you're running a data inspection without any need for pretty charts, then the easiest option is running the FREQUENCIES command shown below.
frequencies salary
/format notable
/histogram.
*/format notable suppresses (huge) frequency tables.
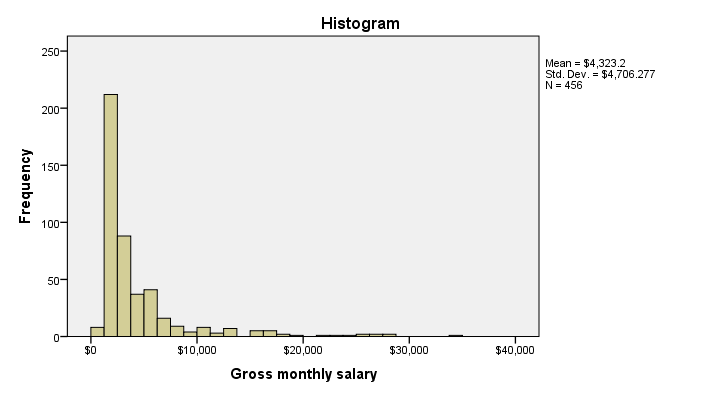
Result
Multiple Histograms in One Go
Running histograms like this does not allow you to use custom titles for your charts. However, it does allow running many histograms in one go as shown below. Oddly, doing so results in variable labels being used as chart titles instead of “Histogram” in our first example.
frequencies whours to overall
/format notable
/histogram.
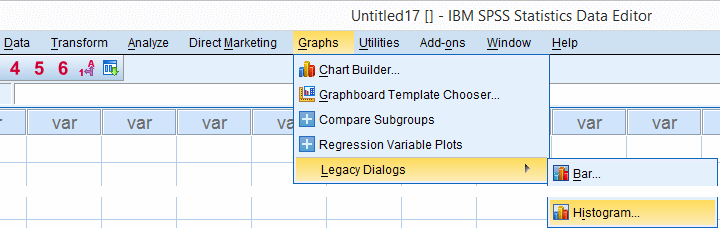
Option 2: GRAPH
If you'd like to include one or more histograms in your report, you probably need somewhat prettier charts. Creating a GRAPH command from the menu -as shown below- allows us to set nice custom titles and makes it easier to style our charts with an SPSS chart template.
SPSS dialogs for charts contain way more charts than most users are aware of and generate much nicer, cleaner syntax than the .
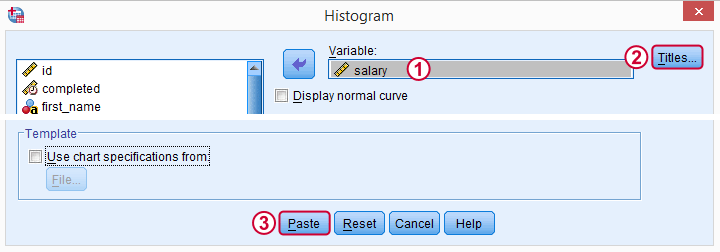
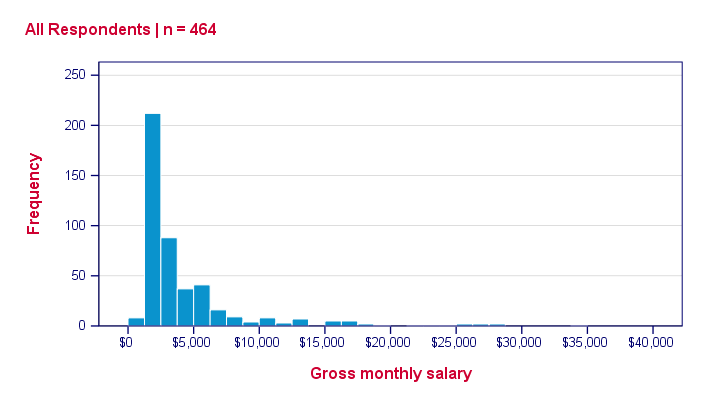
 We'll choose “All Respondents | n = 464” as our main title here because this is relevant but far from obvious.
Resulting Syntax
GRAPH
/HISTOGRAM=salary
/TITLE='All Respondents | n = 464'.
The result still looks pretty much the same. We'll fix that next.
Styling our Histogram
Last but not least, we'll style our histogram. If we save our styling as a chart template, we can easily apply it to all subsequent histograms, which may save us a lot of time. Like so, our final syntax example uses “histogram-nosum-title-720-1.sgt”. (“.sgt” is short for “SPSS Graph Template” but the file is referred to as a chart template.)
If this file is absent, SPSS will throw a warning and still run our histogram with whatever default template -if any- has been set.
SPSS Histogram Syntax with Template
GRAPH
/HISTOGRAM=salary
/TITLE='All Respondents | n = 464'
/template 'histogram-nosum-title-720-1.sgt'.
Final Result
So that's basically it. We could discuss some more options but we don't find them useful in practice, so we'd rather keep it short this time.
We hope you found this tutorial helpful. Thanks for reading!
THIS TUTORIAL HAS 7 COMMENTS:
By Ruben Geert van den Berg on November 26th, 2018
Hi Assipee!
What exactly do you mean by "grouped data"? Could you send us an example?
Sometimes, data hold a variable indicating the number of observations per case (row of cells in data view). In this case, we set this variable as a WEIGHT as in
WEIGHT BY WEIGHTVARIABLE.After doing so, you can proceed as always. However, the N you'll see in the output usually no longer corresponds to the number of cases in data view.
Hope that helps!
SPSS tutorials
By Assipee on November 26th, 2018
HOW DO YOU ENTER THE GROUPED DATA: CLASS INTERVALS: 16-18, 19-21, 22-24, 25-27, 28-30; FREQUENCY: 15, 15, 9, 4, 7 IN SPSS TO OBTAIN A HISTOGRAM WITH THE X-AXIS AS THE CLASS INTERVALS. PLS THE PROCEDURES. THANK!