“I have 5 groups of 10 cases in my data. How can I draw a stratified random sample from these cases? That is, from groups 1 through 5 I'd like to draw exactly 5, 4, 5, 6 and 3 cases at random. What's an efficient way to do this?”
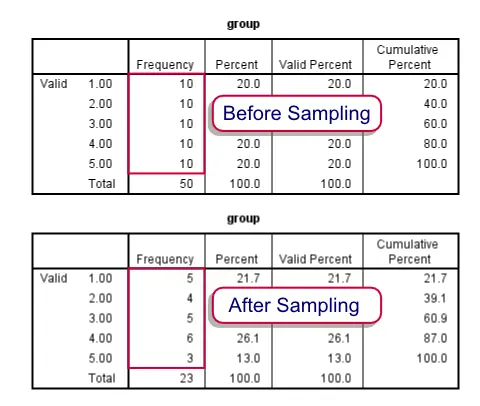 Before and after drawing our stratified sample
Summary
We'll first just demonstrate how to draw the desired sample. After doing so we'll explain in more detail how it works. Unlike the test data we're using here, groups are likely to be defined by more than a single variable. We propose you combine these into a single group variable as described in Combine Categorical Variables. This is not strictly necessary but greatly facilitates the procedure.
Note that the first block of syntax below simply creates a small dataset for demonstrational purposes. We recommend you just run and otherwise ignore it. The actual solution starts in step 3.
SPSS Syntax Example
set seed 1.
input program.
loop group = 1 to 5.
leave group.
loop #cases_per_group = 1 to 10.
end case.
end loop.
end loop.
end file.
end input program.
exe.
*2. Confirm that each group holds 10 cases.
freq group.
*3. Compute completely random variable.
compute random = rv.uniform(0,1).
exe.
*4. Rank random variable within each group.
rank random by group.
*5. Delete 'unsampled' cases from each group.
do repeat current_group = 1 to 5 / desired_freq = 5 4 5 6 3.
select if group ne current_group or rrandom le desired_freq.
end repeat.
*6. Confirm that remaining cases per group are as desired.
frequencies group.
*7. Delete temporary helper variables.
delete variables random rrandom.
SPSS Syntax Steps 3 and 4
The basic trick here is to first COMPUTE a completely random variable. One option for doing so is
COMPUTE random = RV.UNIFORM(0,1).
Depending on your system settings you'll probably see 2 decimals. However, it has many more. You can make them visible by running (for instance) FORMATS random (f6.5). The large number of decimals practically ensures that no ties will occur, which would complicate the approach we're taking here. Next, RANK rrandom BY group. basically results in a counter variable for (randomly sorted) cases within groups.
SPSS Syntax Step 5
Note that at this point it is very easy to draw a fixed number of cases from each group with SELECT IF. For example,SELECT IF rrandom LE 5.will leave a random sample of 5 cases in each group. However, we'd like different numbers of cases from different groups. We can accomplish this with a SELECT IF statement for each group separately. For exampleSELECT IF group NE 1 or rrandom LE 5. deletes all cases from group 1 that have rrandom GT 5. This leaves a random sample of exactly 5 cases in group 1, which we confirm with FREQUENCIES.
Since we'd like such a SELECT IF command for each of our groups, we can shorten our code by wrapping it in a DO REPEAT command.
THIS TUTORIAL HAS 6 COMMENTS:
By Stéfanie on May 6th, 2015
Thanks for this tutorial, it was the only place I could find which shows how I could draw a random person from a household. Thanks!
By Linda Martell on July 15th, 2015
good
By K.M. on October 13th, 2015
Very straightforward - I expected to spend and hour or two on finding out how to do something similar, and now I was done in 5 min. Thanks, this was just what I needed!
By ahmed Hegazy on June 28th, 2016
What about the following syntax if we want to draw a sample of 500 items out of a population of 5465 based on percentages of strata as per Gender and nationality
********************
COMPUTE rnd=RV.UNIFORM(-1,1).
EXECUTE.
SORT CASES BY rnd(A).
compute wtn = 1.
AGGREGATE OUTFILE = * MODE = ADDVARIABLES OVERWRITE = YES
/BREAK= Gender Nationality
/weight=sum(wtn).
compute weight2 = weight*500 / 5465.
IF (weight2<1) weight2=1.
compute weight_Final= RND(weight2).
EXECUTE.
sort cases by Gender Nationality.
compute id = 1.
if (Gender = lag(Gender) AND Nationality= lag(Nationality)) id = lag(id) + 1.
EXECUTE.
SORT CASES BY Gender Nationality.
SELECT IF (id < weight_Final OR id = weight_Final).
SAVE OUTFILE = 'D:\SAMPLE.sav' .
**************************
By JB on April 14th, 2017
Thank you!I created the random variable you suggested and its working now.