In SPSS, we usually work from 3 windows. These are
- the data editor window
 ;
; - the syntax editor window
 ;
; - the output viewer window
 .
.
SPSS’ main window is the data editor. This is the only window that's always open when we run SPSS. Although it's called “data editor”, we use it only for inspecting our data. We strongly recommend you
never edit data in the data editor.
The right way to edit data -and way faster too- is by using syntax, which we'll discuss in the next tutorial.
Right, let's now download and open bank.sav. We'll use it for walking you through the main parts of the data editor.
SPSS Data View & Variable View
An SPSS data file always has two tabs in the left bottom corner:
- Data View is where we inspect our actual data and
- Variable View is where we see additional information about our data.
You can switch between Data View and Variable View by
- clicking the tabs in the left bottom corner;
- using the Ctrl + t shortkey;
- double-clicking a variable name in Data View;
- double-clicking an outline number in Variable View.
Let's first take a close look at the main parts of the Data View tab. We'll then proceed with variable view.
SPSS Data View
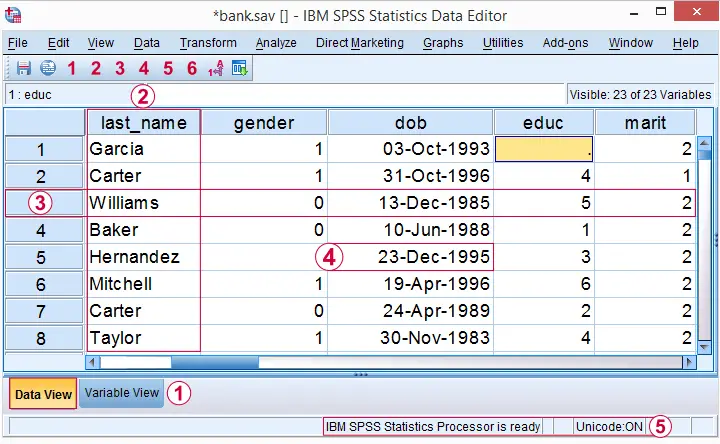
 The data editor has tabs for switching between Data View and Variable View. For now, make sure you're in Data View.
 Columns of cells are called variables. Each variable has a unique name (“gender”) which is shown in the column header.
 Rows of cells are called cases. Oftentimes, each respondent in a study is represented as a single case.
 In SPSS, values refer to cell contents.
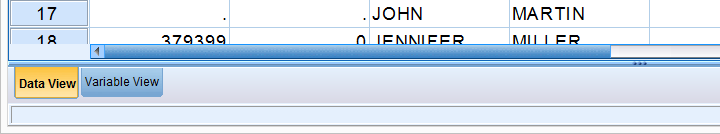
 The status bar may give useful information on the data, for instance whether a WEIGHT, FILTER, SPLIT FILE or Unicode mode is in effect.
These are the main elements in Data View. Let's now switch to Variable View.
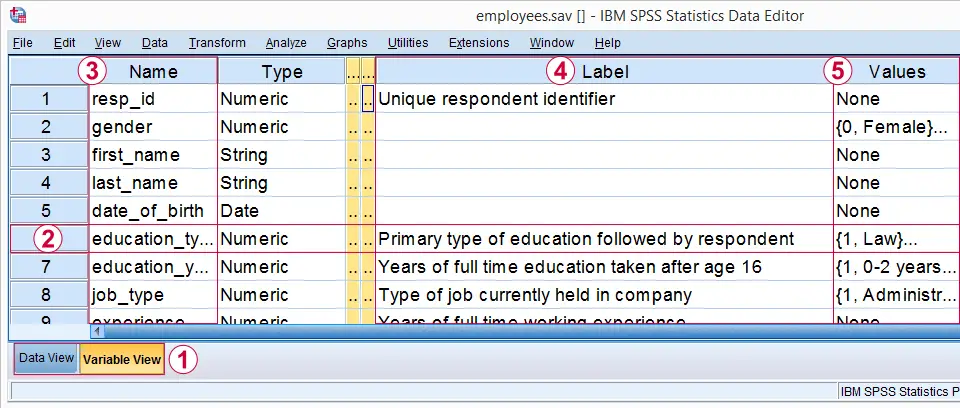
SPSS Variable View
In the left bottom corner we find tabs for switching between Variable View and Data View. For now, select Variable View.
In Variable View, variables are shown as rows of cells.
The first column shows the variable name for each variable.
The fifth column may or may not contain a variable label. This describes the exact meaning of each variable.
The sixth column shows value labels: descriptions of the meaning of one, many or all values that a variable may contain.
In short, Variable View does not show the data itself but, rather, information about the data. This is sometimes called “metadata” or “the codebook”. In SPSS, however, it's called the dictionary.
This is important to know because you may find commands like DISPLAY DICTIONARY or APPLY DICTIONARY in manuals. If you're familiar with syntax, running
DISPLAY DICTIONARY.
creates the output shown below: dictionary information as seen in variable view.
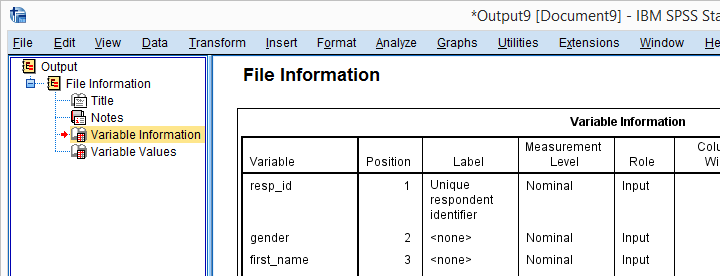 Dictionary information reported by running DISPLAY DICTIONARY.
Variable View - Value Labels
For some variables, it's immediately clear what their values mean: a value of € 2500,- in a variable “gross monthly income” represents a gross monthly income of € 2500,-.
This is not always the case, however: answer categories for categorical variables are often represented by numbers -usually 1 through x. What these values represent is then stored in their value labels. Clicking the open value labels icon ![]() for education_type displays all value labels for this variable.
for education_type displays all value labels for this variable.
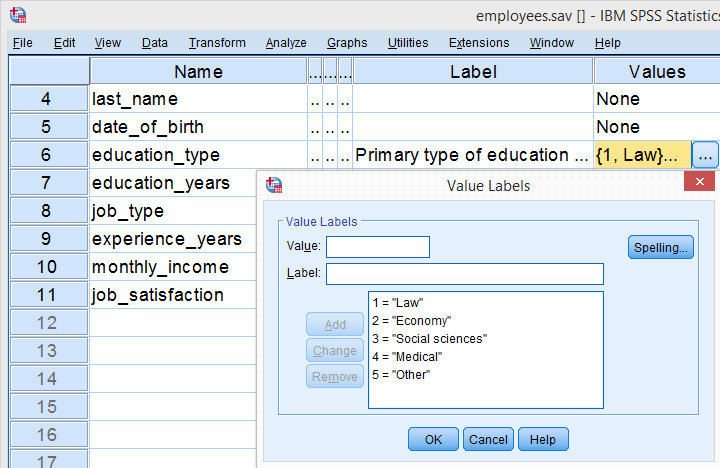 Value labels for education_type.
These value labels tell us that a person with a value of 1 on education_type indicates somebody who studied “Law”. In a similar vein, “Economy” is represented by a value of 2, and so on.
Dictionary Information in Data View
Thus far, we explained that SPSS’ Data Editor always has 2 tabs:
- Data View in which we inspect our actual data values and
- Variable View in which we find information about our data -dictionary information.
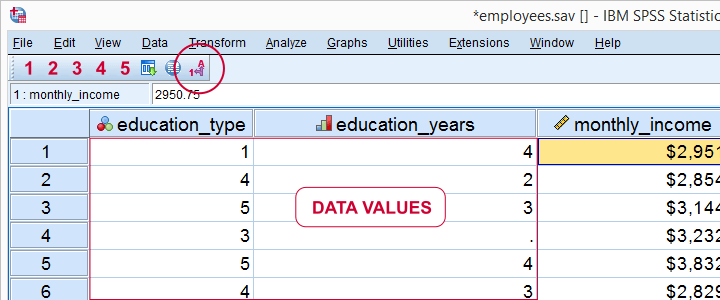
Little known by many SPSS users is that we can see some dictionary information in Data View too. Let's start off with value labels. Initially, we just see data values in Data View as shown below.
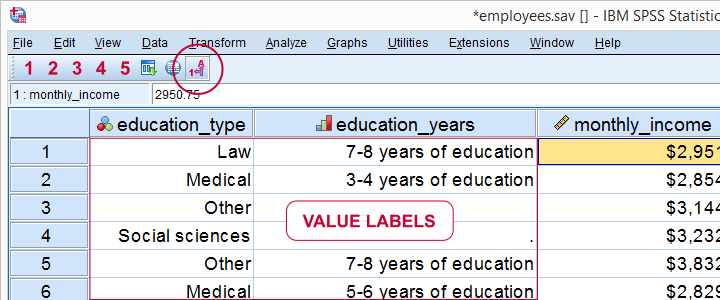
Now, if we click the value labels icon ![]() we'll see value labels instead of data values in data view.
we'll see value labels instead of data values in data view.
So this allows you to look up what your data mean without having to switch between Data View and Variable View. Perhaps even more useful: place your mouse pointer on a variable name in Data View without clicking it. Now a yellow box with a lot of dictionary information pops up for a few seconds.
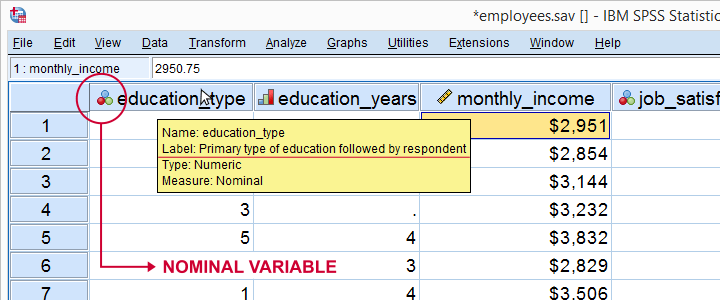
Starting from SPSS version 22, icons next to variable names tell us something about our variable types, formats and measurement levels -if correctly set, that is.
Final Notes
So basically, “data” consist of 2 components:
- data values which we see in Data View and
- dictionary information about our data in Variable View.
We can save the contents of the Data Editor as an SPSS data file or .sav file. If we do so, the resulting file always contains everything in both Data View and Variable view.
Let's reemphasize that you should never -under no circumstances- edit anything manually in either Data View or Variable View. This is perhaps the single worst SPSS practice. And yes, I know. Many SPSS users do this anyway. But most will sooner or later wish they hadn't.
The only sound way to edit your data or dictionary information is by syntax. So let's move on to our next tutorial: SPSS Syntax Introduction.
Thanks for reading.
THIS TUTORIAL HAS 92 COMMENTS:
By John F Hall on July 20th, 2015
1.1.2 Interesting compare this with my Block 1: From questionnaire to SPSS saved file
http://surveyresearch.weebly.com/block-1-from-questionnaire-to-spss-saved-file.html which goes back even further in the data process. How did you get the red numbers and boxes to display over the Data Editor? Nice! In my tutorials I try to use colour-coding for SPSS commands, variable names and for different properties (eg Data Editor comlumns etc) Mine are not always consistent, but it would be interesting to know if users find them helpful. Not sure that property values isn’t confusing: I retain values for variable values and use attributes and properties etc for anything other (eg Columns, Measure, Labels). It would be nice to have an agreed convention for these uses.
dictionary goes to 8.4.5 but SPSS Dictionary Tutorials goes back to 1.1 Getting started.
Value Labels in Data Editor:
Might be an idea to repeat the screenshot to save scrolling back and also to include hyperlinks to previous or following tutorials, rather than, “The next tutorial . . .”
By Ruben Geert van den Berg on July 20th, 2015
Thanks for your feedback! We'd like to make some adjustments to some of these beginners' tutorials. Unfortunately, however, we're not going to have the time in order to do within a couple of months. For now, they'll have to do. But then again, we hope to publish some very interesting new content during August so do stay tuned!
By Anthony Jusu on July 27th, 2015
I am completely lost. I have to start all over again
By SOPHIE MAKOLOMA on August 2nd, 2015
I downloaded employees.sav but could not drag it into SPSS as expected , i need help to meaningfully continue.
By Ruben Geert van den Berg on August 3rd, 2015
Are you on a Mac? And which SPSS version are you one? You should be able to drag any .sav file into the Data Editor window for opening it. Otherwise, double click the file or right click the file and select "Open with...". Note that this is not a good way to open data files, we only use it for now because we haven't learned the proper way (by syntax, that is) at this point.