A magazine publisher surveyed their readers on
 their overall satisfaction with some magazine and
 a number of quality aspects.
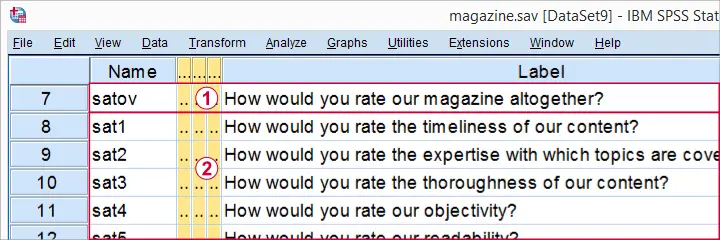
The data -part of which is shown below- are in magazine.sav.
The main research question is which quality aspects have most impact on overall satisfaction? Now, when working with real world data, the first thing you want to do are some basic data checks. This tutorial walks you through just those. The actual regression analysis on the prepared data is covered in the next tutorial, Stepwise Regression in SPSS - Example.
Check for User Missing Values and Coding
We'll first check if we need to set any user missing values. A solid approach here is to run frequency tables while showing values as well as value labels.
set tnumbers both tvars both.
*Check frequency tables for user missing values.
frequencies satov to sat9.
Result
Set User Missing Values
We learn two things from our frequency tables. First, all variables are positively coded: higher values correspond to more positive attitudes. If this is not the case, an easy way to fix it is presented in SPSS - Recode with Value Labels Tool.
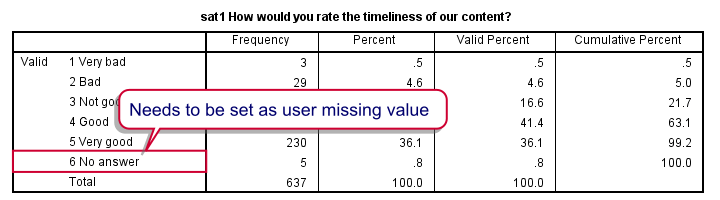
Second, we need to set 6 as a user missing value for our quality aspects. We'll do so with the syntax below. We'll take a look at our frequency distributions as well.
missing values sat1 to sat9 (6).
*Inspect histograms but don't create frequency tables again.
frequencies satov to sat9
/format notable /*DON'T CREATE ANY TABLES*/
/histogram.
Result
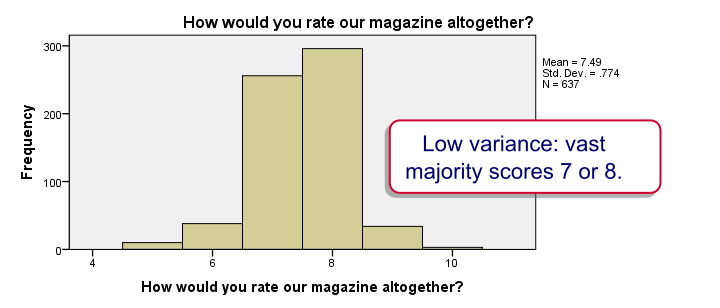
Our histograms don't show anything alarming except that many variables have rather low variances. This tends to result in rather limited correlations as we'll see in a minute.
Inspect Missing Values per Case
We'll now inspect how our missing values are distributed over cases with the syntax below.
compute mis1 = nmiss(satov to sat9).
*Apply variable label to new missingness variable.
variable labels mis1 "Number of (system or user) missings over satov to sat9".
*Inspect missing values per case.
frequencies mis1.
Result
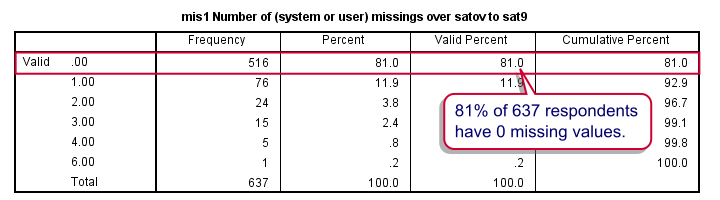
Cases with many missing values may complicate analyses and we find them suspicious. But then again, we'd like to use as much of our data as possible. If we don't allow any missings, we'll lose 19% of our sample. We therefore decide to exclude only cases with 4 or more missing values.
Filter Out Cases with 4 or More Missings
compute filt1 = (mis1 <= 3).
*Apply variable label to filter variable.
variable labels filt1 "Filter for 3 or fewer missings over satov to sat9".
*Activate filter variable.
filter by filt1.
*Check if filter works properly.
frequencies mis1.
Inspect Missing Values per Variable
We'll also take a look at how missings are distributed over our variables: do all variables have a sufficient number of valid values or do we need to exclude one or more variables from our analyses?
descriptives satov to sat9.
Result
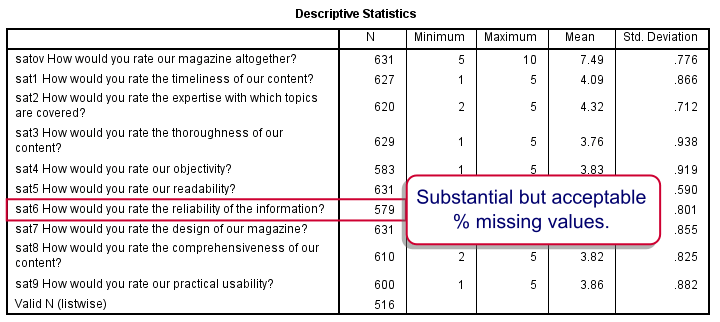
None of our variables seems problematic. The lowest N is seen for sat6 (reliability of information). Perhaps our respondents found this aspect hard to judge.
Inspect Pearson Correlations
Last but not least, we want to make sure our correlations look plausible. We'll take a quick look at the entire correlation matrix.
correlations satov to sat9.
*Save edited data file for regression.
save outfile 'magazine_reg.sav'.
Result
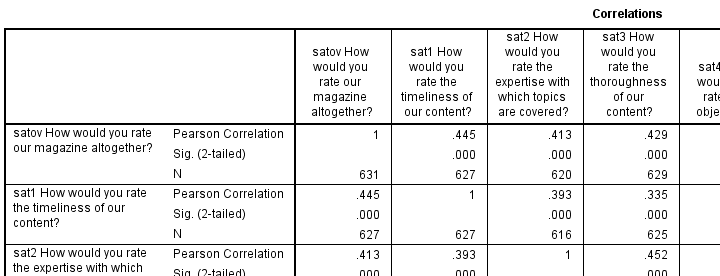
Things to watch out for are correlations in the “wrong” direction (positive where negative would make sense or reversely). This may result from some variables being positively coded and others negatively but we already saw that's not the case with our data.
Less common but very problematic are correlations close or equal to -1 or 1 which can result from (nearly) duplicate variables. This is not an issue here either.
We're now good to go for our regression analysis. Since we created a filter variable, we'll save our data as magazine_reg.sav. We'll use this file as input for our next tutorial.
THIS TUTORIAL HAS 6 COMMENTS:
By Haxson Twaibu on March 15th, 2019
Very educative. Need to have a copy of these tutorials.