Introduction
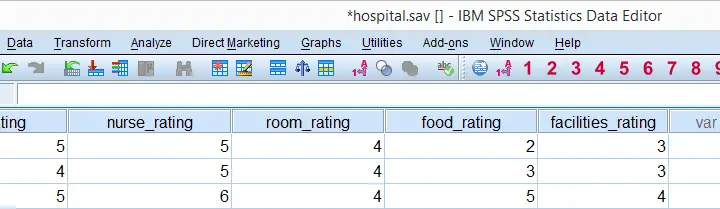
Having a basic understanding of SPSS numeric variables allows you to work fast and with a sense of confidence. This tutorial aims at accomplishing just that by pointing out some essential basics. You may follow along with this tutorial by downloading and opening hospital.sav.
SPSS Numeric Variables - What Are They?
Numeric variables are one of SPSS' two variable types. They can be defined as variables that contain only numbers as values.More precisely, their values are double-precision floating-point numbers. This is not as obvious as it seems because numeric values may not look like numbers at all.
When we realize that the values we see may be (very) different from the actual values, we'll get things done much more efficiently, especially when it comes to date variables and time variables. We'll demonstrate this point with some examples in a minute.
SPSS Numeric Formats
SPSS' standard numeric format is the “F” format. It controls how values are shown. For example, F5.2 is shown as “12.34” Basic rules for the F format are that
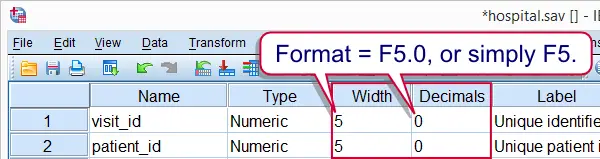
- its first digit is the total number of characters to display. This includes a decimal separator if needed. It is shown as “Width” under variable view as shown in the screenshot below.
- The second digit is the number of decimal places to display. It is shown as “Decimals” under variable view. It must always be smaller than the first digit because the decimal separator, if present, takes up one character.
- The second digit is optional. For instance, F5 is a shorthand for F5.0.
A possible source of confusion here is that SPSS will always attempt to show all integers, even if insufficient characters are set. For example, run
formats visit_id(f1).
on our data. We see under variable view that the width for visit_id is indeed 1 but under data view we still see 5 digits.For now, all seems fine. However, the insufficient variable width may cause problems in some cases.
Other numeric formats in SPSS include date, time, datetime and some others. We'll discuss those in separate tutorials.
SPSS Numeric Variables - Hidden Decimals
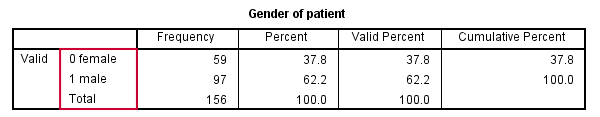
A main point of this tutorial is that the actual numeric values in SPSS may differ from the values we see. Realizing this takes away a lot of confusion. In order to make this clear, let's inspect the frequency table for gender by running FREQUENCIES. The screenshot shows the resulting table.
set tnumbers both.
*2. Frequencies gender.
frequencies gender.
Nothing remarkable thus far, right? Ok, let's now do something unusual: we'll add 0.1 to all values of gender and rerun the table we just saw. The result is shown in the next screenshot.
compute gender = gender + .1.
*2. Due to the F1 format, 0.1 is shown as 0 and 1.1 as 1.
frequencies gender.
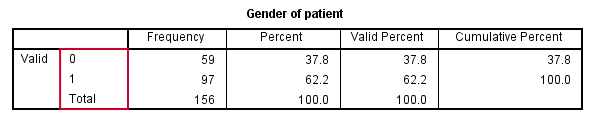
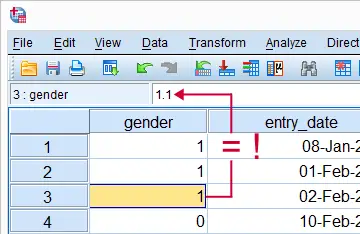
What happened to the value labels? Well, nothing; the value labels were given to values 0 and 1 but gender now holds 0.1 and 1.1 as values. No labels were given to those values.
The confusing part is that 0.1 and 1.1 are shown as 0 and 1 in the output viewer window. The same goes the data view. However, here we see the actual value in the formula bar after selecting a cell. This is shown by the screenshot.
The situation really becomes clear by displaying an extra decimal. We can do so by running formats gender(f3.1). Keep in mind that showing an extra decimal doesn't change anything about the actual values. They are still 0.1 and 1.1. Now, you may think that we can always see the actual values in the formula bar when we click one of the cells as shown in the screenshot. However, this doesn't hold for other numeric formats than F as we'll show next.
SPSS Numeric Variables - Datetime
Now, let's click on any value of exit_moment. The formula bar will show exactly the value we clicked as shown in the screenshot.
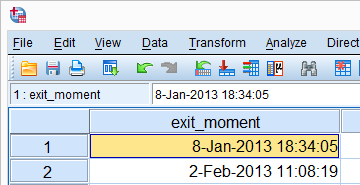
Remember that numeric variables may contain only numbers. So the value we see, including some letters, can't be the actual value. In order to see the latter, run formats exit_moment(f1).
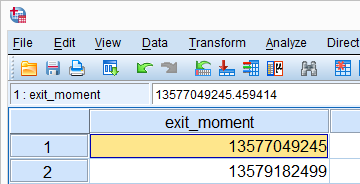
As we see in the formula bar, the actual value is a huge number with many decimals. Why is this relevant? Well, its this actual value that numeric functions operate upon.
Now, without getting too far ahead of things, SPSS datetime variables contain numbers of seconds. Since an hour contains 3600 seconds, simply adding 3600 to all values is equivalent to increasing them by one hour. This also works if we display our datetime values in datetime format as the syntax below demonstrates.
formats exit_moment(datetime22).
*2. Set all datetime values one hour ahead.
compute exit_moment = exit_moment + 3600.
exe.