This handy tool will set the exact sizes for one or many charts in the active output window.
SPSS Set Chart Sizes Tool - How to Use it
- This tool requires SPSS version 18 or higher. For SPSS versions 14 through 17, you can use the syntax version from SPSS Set Chart Sizes with Syntax Tool.
- Before proceeding, make sure you've the SPSS Python Essentials properly installed and running.
- Generate one or many charts.
- Download and install the SPSS Set Chart Sizes Tool. Note that this is an SPSS Extension Bundle.
- Navigate to
 and fill out the dialog that pops up.
 - and run the syntax.
- Note that clicking directs you to the online tutorial you're currently reading.
SPSS Set Chart Sizes Tool - Example 1
Right, let's download and open employees.sav. We'll do so and generate two basic charts by running the syntax below.
frequencies gender/barchart.
GRAPH /HISTOGRAM=date_of_birth /PANEL COLVAR=gender COLOP=CROSS.
Now let's say we want the last chart to be 800 by 400 points. We'll open the Set Chart Sizes dialog under and fill it out as shown below.
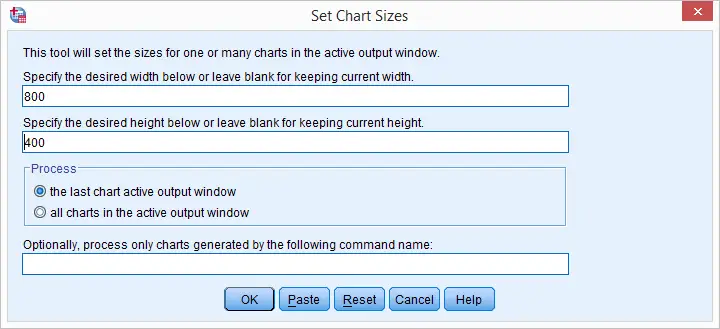
Clicking now results in SPSSTUTORIALS SETCHARTSIZES WIDTH='800' HEIGHT='400' CHARTS='Last' FILTER=''. Running this line of syntax will set the size of the last chart in the active output window to 800 by 400 points.
SPSS Set Chart Sizes Tool - Example 2
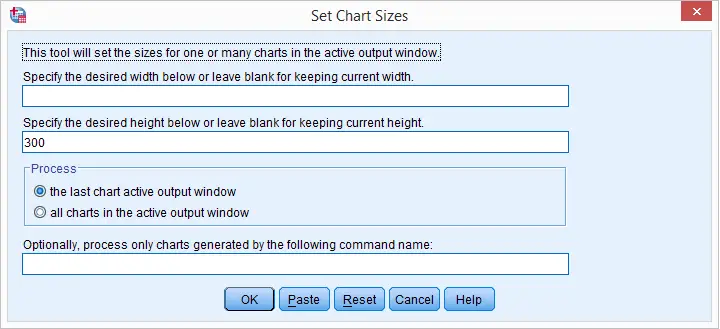
Now let's say we want all charts generated by FREQUENCIES to have a height of 300 points. We want to leave the width unaltered. For doing so, we'll fill out the Set Chart Sizes dialog as shown below. Note that the command name is case insensitive: “frequencies”, “FREQUENCIES” or even “fReQuEnCiEs” are all equivalent.
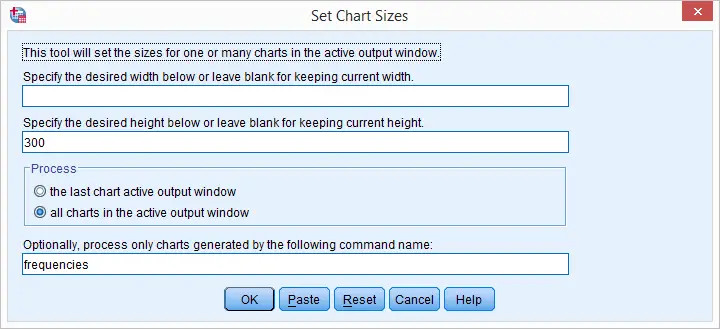
After clicking we now get SPSSTUTORIALS SETCHARTSIZES WIDTH='' HEIGHT='300' CHARTS='All' FILTER='frequencies'. Running this sets the height of all charts in the active output window generated by a FREQUENCIES command to 300 points.
Final Notes
Setting exact chart sizes manually is cumbersome; while changing a chart's width or height, you don't see these values change until you're done (and discover the values are not as desired).
Perhaps more importantly, keep in mind that such manual modifications are not replicable; if you need to rerun (some of) your charts, you'll have to do everything all over again.
A sound way for setting chart sizes is by means of SPSS chart templates. However, we feel that using the tool presented in this tutorial is a much easier and faster alternative.
Thanks for reading!
THIS TUTORIAL HAS 3 COMMENTS:
By Michael on January 12th, 2022
Dear Ruben, this tool (resize the charts in the SPSS output) was very useful to me so far. Now with SPSS 28 it doesn't work any more as Python 2 was deprecated. Do you plan to update it to be compatible with the Version 28? If so, it is much appreciated. I tried to modify it by my own but it didn't worked as I am not that experienced with Python.
Thank you in any case for you work!
Michael
By Ruben Geert van den Berg on January 13th, 2022
Dear Michael,
We updated most of our tools for Python3 but we often can't find the time to update the articles on them as well.
For the updated Set Chart Sizes Tool, try SPSS_TUTORIALS_SET_CHART_SIZES.spe.
Hope that helps!
Ruben
SPSS tutorials
By Michael on January 13th, 2022
Dear Ruben,
thank you very much for the quick reply! The updated version of the chart-size-tool works perfekt with SPSS 28!