Contents
SPSS syntax is a language containing instructions for
analyzing and editing data and other SPSS commands.
- How to paste SPSS syntax?
- How to run SPSS syntax?
- Writing simpler syntax
- How to get SPSS syntax?
- Why even use SPSS syntax?
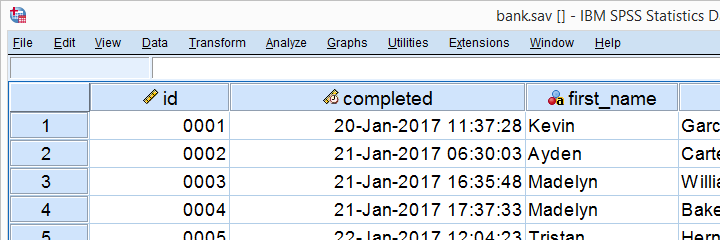
SPSS users working directly from the menu may not actually see they syntax they're running. However, this is a terrible practice and we'll explain why in a minute. So let's download and open bank.sav -partly shown below- and jump right in.
How to paste SPSS syntax?
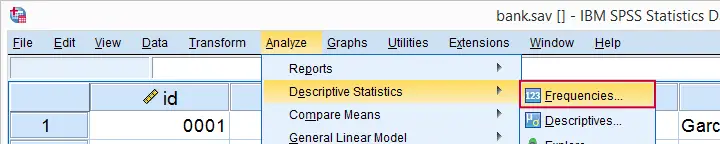
Now let's suppose I'd like to gain some insight into the percentages of male and female respondents. I could first navigate to
![]()
![]() as shown below.
as shown below.
I'll now  move gender into the variable box and perhaps
  request a bar chart as well.
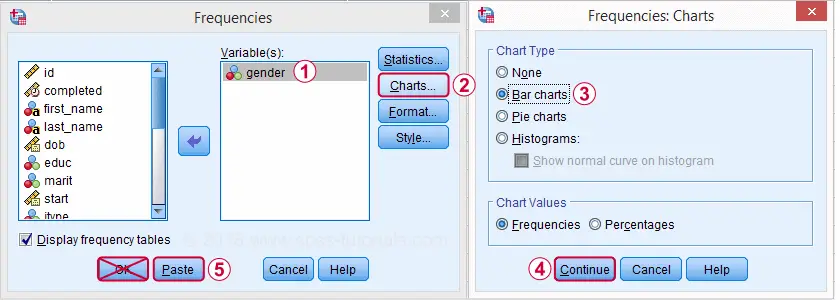
Now clicking may seem the obvious thing to do. A much better idea, however, is to click the button. Upon doing so, a new SPSS window opens which is known as the Syntax Editor. It's recognized by the orange icon ![]() in its left top corner.
in its left top corner.
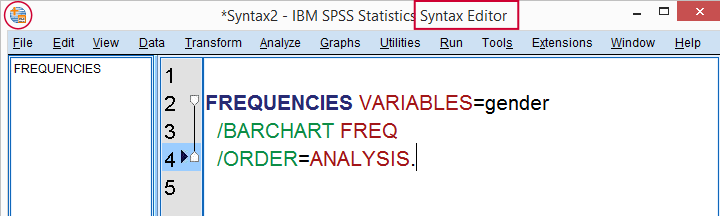
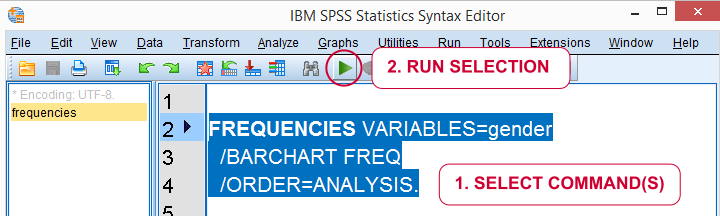
The Syntax Editor contains a FREQUENCIES command which holds the instructions we just gave SPSS in the Frequencies dialog. However, we don't see the frequency distribution and bar chart we asked for. This is because we still need to run the command we just created.
How to run SPSS syntax?
The simplest way to run syntax is to select the command(s) you'd like to run and click the “run selection” icon ![]() in your toolbar.
in your toolbar.
A faster way to run syntax is to use several shortkeys, especially
- F2 for selecting the command in which your mouse pointer is located;
- Ctrl + a for selecting all syntax;
- Ctrl + r for running all selected commands.
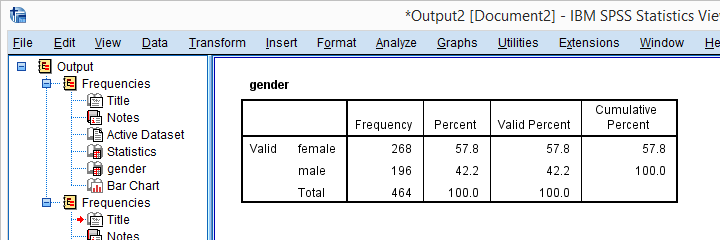
So let's now run our pasted syntax. On doing so, a new window will open, containing our frequency table and barchart. This is an output window which we'll discuss in our next tutorial.
How to get SPSS syntax?
The right way to do basically anything in SPSS -editing and analyzing data, creating tables and charts and more- is by running syntax. So how to get syntax? First off, using the button from the menus adds syntax to your syntax window. If you don't have a syntax window open yet, it'll open one for you. Options for opening a syntax window are
- using the button from the menus;
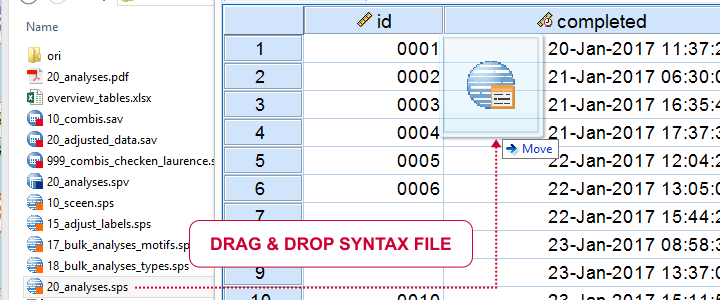
- drag and drop a syntax file into the Data Editor window (shown below);
- clicking the New Syntax
 toolbar icon;
 - Navigate to
 .
.
If you've a syntax window open, you still need the actual syntax. Options to get the syntax you need are
- use the button from SPSS’ menu;
- copy-paste syntax from our tutorials, online forums and elsewhere;
- type the commands you need into the syntax window.
Now, typing syntax may seem like a crazy thing to do at this point. However, typing syntax is much easier than it seems because most of it can be dramatically simplified.
Writing simpler syntax
The syntax we just pasted from the menu was:
/BARCHART FREQ
/ORDER=ANALYSIS.
Now typing all that manually is a lot of work. However, we'll get the exact same results if we run:
/barchart.
Just typing and running this is much faster and easier than clicking through all menu options. So if you want to get real good -and real fast- with SPSS, start learning short syntax. This will take some practice but it will save you tons of time and effort in the longer run.
SPSS Syntax Files
We can now save all contents of our Syntax Editor as a syntax file by going to
![]() The resulting syntax file has the .sps (for “SPSS syntax”) file extension and is a plain text file. You can open, edit and save it with SPSS or any text editor such as Notepad++.
The resulting syntax file has the .sps (for “SPSS syntax”) file extension and is a plain text file. You can open, edit and save it with SPSS or any text editor such as Notepad++.
When saving syntax in newer SPSS versions, something like
* Encoding: UTF-8.
may be added. Just leave and ignore this, it's not meant for you but, rather, some kind of “note to self” from SPSS.
Why even use SPSS syntax?
The single best SPSS practice is doing everything from syntax. Some reasons for this are
- you'll always know exactly which steps you took in which order so you can prove that your results are correct;
- if you made some mistake -don't we all sometimes?- you can correct it and rerun everything you did in just seconds;
- you'll work way faster than from the menu and you never have to do things twice;
- some of the best SPSS tricks and time savers are available as syntax only.
So say you run 10 tables and charts from the menu. And then you realize you should have filtered out all respondents working in IT. Now you have to start all over again: remove the unwanted respondents and click your way through all the same menus and dialogs again...
Sounds like a terrible idea. Doesn't it?
Unfortunately, I see students having to do days of SPSS work all over again on a daily basis. Not working from syntax really is the very worst SPSS practice.
So say I run those 10 tables and charts and I saved all syntax. Then I realize I should have filtered out all respondents working in IT. Ok. No problem. I'll just add
SELECT IF (jtype <> 3).
to the top of my syntax and rerun all tables and charts in one go.
Thanks for reading!
THIS TUTORIAL HAS 70 COMMENTS:
By Sue Wilson on September 1st, 2015
A good explanation of how to begin with syntax.
By Brij on January 11th, 2016
I tried opening employees. sav, it show's an error #5263 command Get File.
The specified input data file is neither an SPSS statistics data filed nor an SPSS/PC+ data file.
By Ruben Geert van den Berg on January 11th, 2016
It strikes me there's a space between "employees." and "sav" in your comment. If you used syntax for opening the file, please make sure you remove this space. If that doesn't solve the problem, please give me some more details. I'm pretty sure there's no problem in the .sav file as it's been opened by thousands of users already.
By Emils Bisenieks on February 15th, 2016
I cant download employees.sav! Can you help me? After clicking the link, it shows this: $FL2@(#) IBM SPSS STATISTICS 64-bit MS Windows 22.0.0.0 ...
By Ruben Geert van den Berg on February 15th, 2016
First of all, don't use Internet Explorer. Ever. For anything.
If you're forced to use it anyway (for instance, by an employer), try right clicking the link => "save target as...".
Please let me know if that solves the problem, ok?