SPSS TableLooks are files that contain styling
-colors, fonts, borders and more- for SPSS output tables.
- What can I (not) do with TableLooks?
- Applying TableLooks
- Creating TableLooks
- Developing TableLooks
- Issues with TableLooks
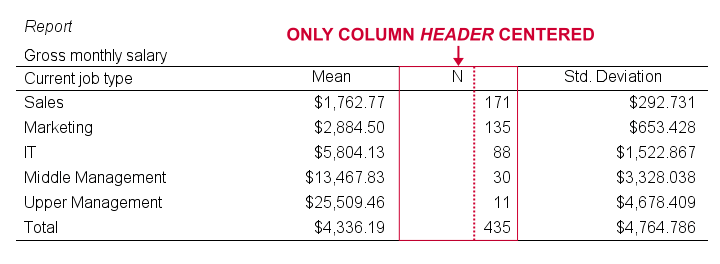
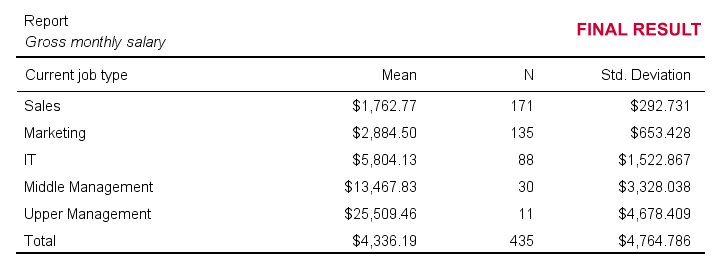 Output Table Styled by TableLook Example
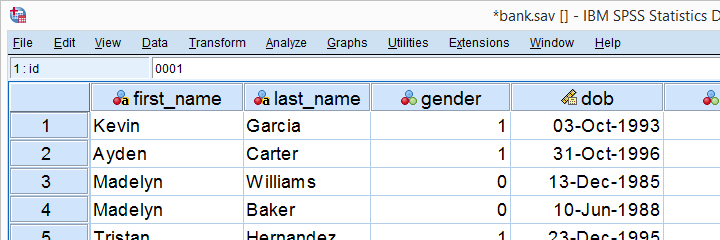
Practice Data File
This tutorial uses bank_clean.sav throughout. Part of its data view is shown below. Feel free to download these data and try the examples we'll run for yourself.
What are TableLooks?
SPSS TableLooks are tiny text files written in XML. They contain styling for output tables such as
- colors for text, backgrounds and borders;
- fonts: sizes, families and styles;
- widths for columns and row labels but -unfortunately- not entire tables;
- which borders to apply in which widths and colors.
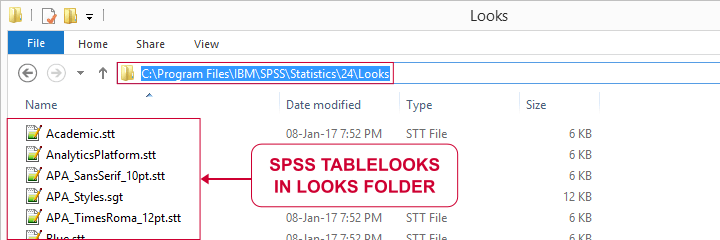
TableLooks have the .stt file extension (.stt is short for SPSS table template, the old name for TableLooks). SPSS ships with some TableLooks which you find in the Looks subfolder as shown below.
Ironically, some of these TableLooks don't work because they contain errors. But we'll get to that later.
Some things TableLooks can't do are
- applying conditional styling such as boldfacing correlations that are statistically significant;
- setting numeric formats for SPSS output such as decimal places and percent signs.
For these modifications, try OUTPUT MODIFY instead.
Applying TableLooks
Let's first create a very simple means table. The fastest way to do so is running the following line of syntax: means salary by jtype. If you're on SPSS version 23 or higher, the resulting table looks awful.
 Default Table Styling for SPSS 23 and Higher
However, if we set a different TableLook and rerun the table, it'll look way better. The syntax below does just that. Note that you probably need to change the path to your Looks folder.
Set TableLook and Rerun Means Table
set tlook 'C:\Program Files\IBM\SPSS\Statistics\24\Looks\APA_TimesRoma_12pt.stt'.
*Rerun basic means table.
means salary by jtype.
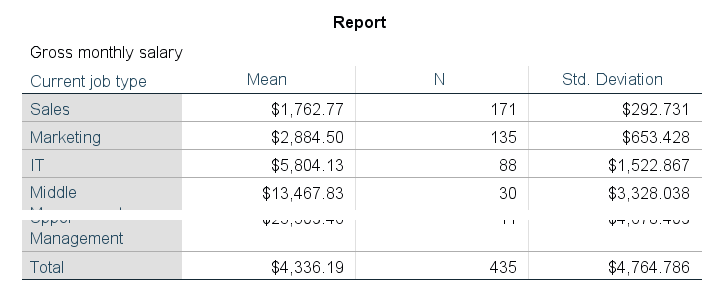
Result
This already looks much better, doesn't it? However, the text alignment is somewhat awkward and does not follow APA guidelines. Can't we do better? Yes we can.
Creating TableLooks
Let's double-click this last table and open the menu as shown below. If it looks different, make sure you double-click the table. We'll briefly discuss its main options below.
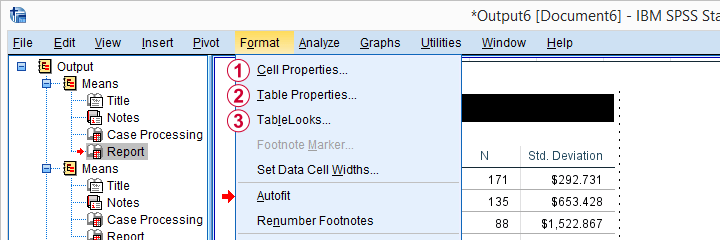
 Set properties for a selection of table cells here. However, these changes can't be saved as a TableLook (.stt) file.
 Set properties for table areas -titles, headers, data cells- here. These changes can be saved as a TableLook.
 After editing some table, save its styling as a TableLook here.
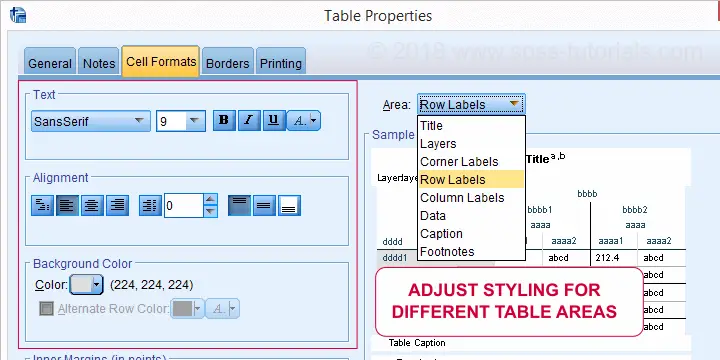
Since we'd like to make changes that we can save as a TableLook, we choose Table Properties. We can now set styles for different table areas as shown below.
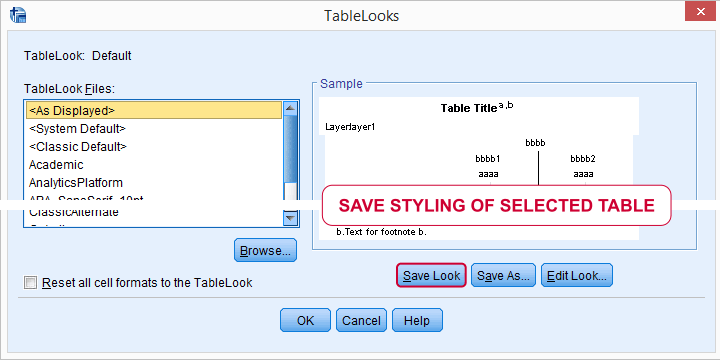
When we're done, we'll double-click our table again and select TableLooks. We can now save the styling we just applied as a new or existing TableLook (.stt) file.
We can now activate our TableLook by running something like set tlook 'd:/data/myNewTableLook.stt'. From now on, all tables we'll create will look great! Like the one shown below, for example.
Output Table Styled by TableLook Example
If you want to revert to the ugly SPSS defaults, you can do so by running set tlook none.
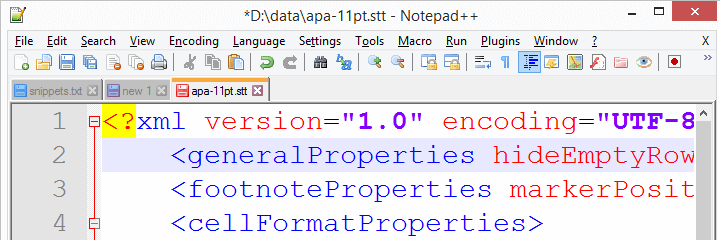
Developing TableLooks
If you're not afraid of code, there's a faster way to develop TableLooks: you can edit their XML directly in some text editor such as Notepad++. The screenshot below shows what that looks like.
Issues with TableLooks
As we already mentioned, some TableLooks developed by IBM SPSS don't work in recent SPSS versions. For an example, try and run the syntax below.
set tlook 'C:\Program Files\IBM\SPSS\Statistics\25\Looks\LargeFont.stt'.
*Running table triggers warning and ugly default styling is used.
frequencies jtype.
Result
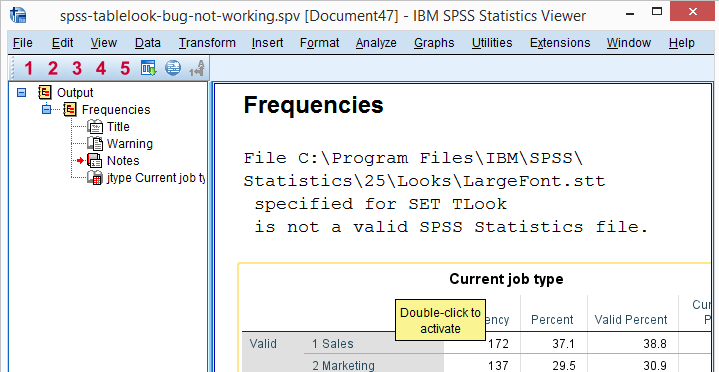
So when we activate this TableLook, everything seems fine. However, as soon as we actually run some table, we get the following warning: File C:\Program Files\IBM\SPSS\Statistics\25\Looks\LargeFont.stt specified for SET TLook is not a valid SPSS Statistics file. This warning comes up whenever a TableLook file contains errors. Which is somewhat ironic for a TableLook that ships with SPSS.
A second issue with SET TLOOK is that it ignores the CD setting. I always deliver entire projects -all data, syntax, output and templates- to my clients. This allows them to replicate exactly everything I did. I really feel that
this should be the standard for any professional.
Right, so my clients usually download the project folder holding all necessary files. Next, they only need to change the CD setting and
- GET opens the right data file,
- SET CTEMPLATE sets the right chart templates,
- INSERT runs the right syntax files and
- OUTPUT SAVE saves the output in the right folder and then
- SET TLOOK crashes
for no apparent reason. It would be nice if this annoying issue would be fixed rather than just mentioned in the documentation.
Right, I guess that'll do for a quick introduction to SPSS TableLooks. Hope you found it helpful.
Thanks for reading!
THIS TUTORIAL HAS 6 COMMENTS:
By Benjamin Shinar on April 9th, 2018
question about editing stt files.
we have a stt file that governs how all our tables look, it was mostly created by copying other fies and trial and error.
we now want to change the format of the cells in the row labels column (does it make sense?). it currently displays numeric values without the decimal point, which makes 1, 1.25 and 1.5 all appear as 1 in thhe output sfv.
how do we change it in the stt file?
is there a reference sheet that lists all available values we can change/control foor the appearence of the table?
By Ruben Geert van den Berg on April 9th, 2018
Hi Benjamin!
First off, I think you can't set any decimal places with an .stt file. At least, I've never seen that.
Decimal places in tables are -insofar as I know- determined by the formats of your variables. So try increasing them with something like
FORMATS V1 TO V10 (F4.2).and then rerun your tables.If that doesn't help, send the .stt file to info@sigma-plus-consulting and I'll have a look at it.
By Benjamin Shinar on April 10th, 2018
changing the variable format works.
I can change the decimal places manually by: double clicking the table, cell properties (format value tab) and then changing the decmials.
i was hoping that I could do it from the stt.
also, is there a refernce card that lists what i can control through the stt and the possible values?
By Ruben Geert van den Berg on April 10th, 2018
No, there's no reference card. Table templates basically just fix your styling such as borders, fonts and background colors. They should transpose tables too but this doesn't work.
Don't edit tables manually. You can do so with Python scripting. One example is Set Decimals for Output Tables Tool (requires SPSS 18 or higher). You could build a similar tool for row/column labels.
Hope that helps!
By Jon K Peck on November 13th, 2018
TableLooks are a much overlooked but very useful feature, so I'm glad to see this post. A few comments...
Your image of the default look is not what I see using the default (25.0.0.1). It looks much better IMO. I can't post the image in the comment.
Running SET TLOOK with no argument does not crash on my system.
SET TLOOK does not honor CD as it is intended to be a user-level setting abstracted a level from a project level. This behavior is documented in the CSR.
It may not be obvious to the reader that OUTPUT MODIFY can specify a tableLook to be applied to specific tables apart from the SET TLOOK appearance.
The problem with the LargeFonts tableLook is that it specifies the maxima for column width with values like 84pts, but the schema calls for an integer value.