The variance is a number that indicates how far a set of numbers lie apart. The variance is identical to the squared standard deviation and hence expresses “the same thing” (but more strongly).
Variance - Example
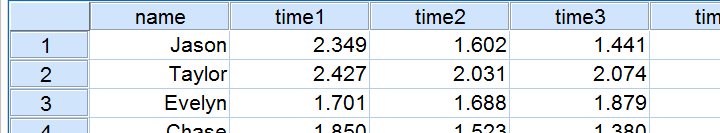
A study has 100 people perform a simple speed task during 80 trials. For each participant, 80 reaction times (in seconds) are thus recorded. Part of these data are shown below.
In studies like these, we typically see that people get faster as they perform the speed task more often. That is, the average reaction time tends to decrease over trials.
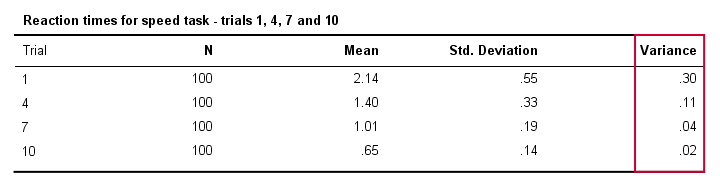
Also, reaction times will typically vary less between different people insofar as they perform the task more often. Technically, we say that the variance decreases over trials. The table below illustrates this for trials 1,4,7 and 10.
Variance and Histogram
A great way to visualize the data from our previous table is a histogram for each trial. Like so, the figure below illustrates that participants got faster over trials; from trial 1 to trial 10 the histogram bars move leftwards, towards 0 seconds.
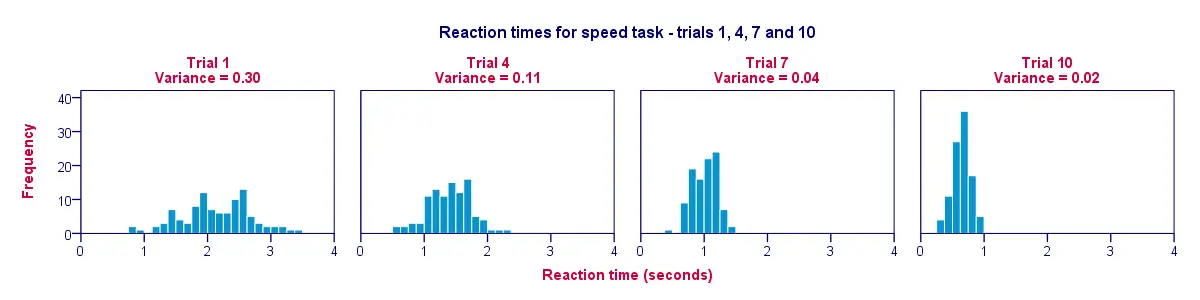
A second finding is that the histograms become narrower (and therefore higher) as we move from trial 1 to trial 10; this illustrates that reaction times vary less and less between our participants as the experiment progresses. The variance decreases over trials.
Variance - Population Formula
A basic formula for calculating the variance is
$$S^2 = \frac{\sum(X - \overline{X})^2}{n}$$
We recommend you try to understand what this formula does because this helps a lot in understanding ANOVA (= analysis of variance). We'll therefore demonstrate it on a mere handful of data.
Variance - GoogleSheets
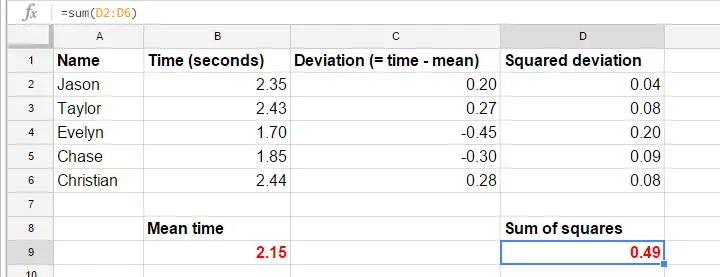
For the sake of simplicity, we'll cut down our data to the first trial for the first 5 participants. These 5 reaction times -and a manual calculation of their variance- are in this GoogleSheet.
Variance - Calculation Steps
The formulas in the GoogleSheet show precisely how to calculate a variance. The basic steps are
- calculate the mean reaction time (2.15);
- calculate deviation scores (reaction time minus mean reaction time);
- calculate squared deviation scores;
- add squared deviation scores. The result (0.49) is a sum of squares, the main building block of ANOVA;
- divide the sum of squares by the number of observations (5 reaction times).
Alternatively, calculate a variance by typing =VARP(B2:B6) in some cell (B2:B6 are the cells that hold our 5 reaction times). VARP is short for “variance population”. OpenOffice and MS Excel contain similar formulas.
Variance - Sample Formula
Similarly to the standard deviation, if our data are a simple random sample from a much larger population, the aforementioned formula will systematically underestimate the population variance. In this case we'll use a slightly different formula:
$$S^2 = \frac{\sum(X_i - \overline{X})^2}{n - 1}$$
Which formula to use thus depends on our data: do they contain the entire population we'd like to investigate or are they a mere sample from this population?
Since our 100 participants are clearly a sample, we'll use the sample formula. In GoogleSheets, typing =VAR(B2:B6) in some cell will return the sample variance.
Variance in SPSS
Insofar as we know, the formula for the population variance is completely absent from SPSS and we consider this a serious flaw. Instead, SPSS always uses the sample formula.This goes for the between subjects variance (discussed in this tutorial) as well as the within subjects variance. Relevant output is shown below.
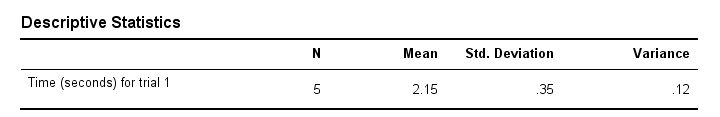
Regarding this output table, also note that the variance is indeed the squared standard deviation (apart from rounding).
Regarding the variance, that's about it. We hope you found this tutorial helpful in understanding what a variance is.
THIS TUTORIAL HAS 7 COMMENTS:
By Anna K on September 24th, 2019
Hi! Variance - Population Formula - why divided by n (why not n-1)? it is sample, not general pop...
Thanx
By Ruben Geert van den Berg on September 24th, 2019
Not all data are a sample, Anna. This is a very common misunderstanding and a ubiquitous flaw of most statistics tutorials.
Perhaps I have a company with 5 employees and I'd like to learn about only my 5 employees. In that case, I'll study a population of N = 5 and I'll use the population formula.