SPSS MEANS produces tables containing means and/or other statistics for different groups of cases. These groups are defined by one or more categorical variables. If assumptions are met, MEANS can be followed up by an ANOVA.
This tutorial walks through its main options, pointing out some tips and tricks. You may follow along by downloading and opening freelancers.sav.
SPSS Quick Data Check
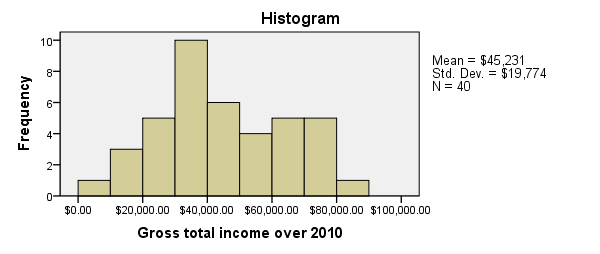
Since we'll run some tables on income_2010, we'll first take a quick look at its histogram by running FREQUENCIES. Note that the second line in the syntax below suppresses frequency tables. We also hide all decimals for income_2010 with FORMATS for suppressing excessive decimals in the output tables.
frequencies income_2010
/format notable
/histogram.
*2. Suppress excessive decimal places somewhat.
formats income_2010(dollar8).
SPSS MEANS - Minimal Use
Since our histogram doesn't indicate anything unusual, we can now run MEANS. The most simple way to do so is running means income_2010.
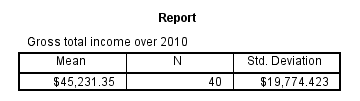
The result is basically the same as DESCRIPTIVES for a single variable but when multiple variables are specified, MEANS will use a different table structure which we'll see later on.
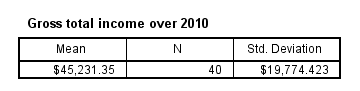
One thing we don't like here is the title (“Report”). However, by using an SPSS Table Template (.stt file), we can make it invisible and enlarge the variable label of the row variable (“Gross total ...”) so it will look like the title. We'll do so throughout the remainder of this tutorial.
SPSS MEANS - Typical Use
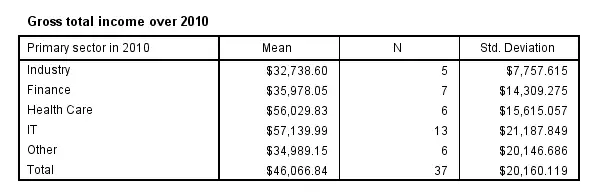
The first MEANS example produced mean incomes over all cases. However, we'll typically use MEANS for generating means for different groups of cases. Like so, the syntax below produces mean incomes for different sectors separately.
means income_2010 by sector_2010.
SPSS MEANS - CELLS Subcommand
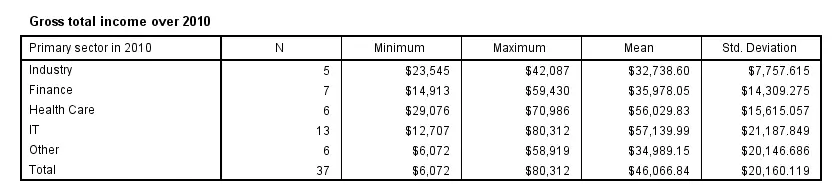
The syntax below has a second line containing a CELLS subcommand. It specifies which statistics (columns) are included in which order.
Note that MEANS has more options here than DESCRIPTIVES, all of which can be included by specifying ALL on the CELLS subcommand.
means income_2010 by sector_2010
/cells count min max mean stddev.
SPSS MEANS - Multiway Tables
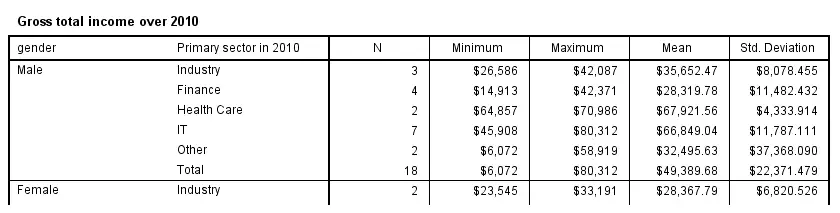
Multiway tables are generated by using more than one BY clause. For example, the syntax below produces mean incomes for each combination of gender and sector separately. You can use even more than two row variables but the resulting table will be rather messy in this case.
means income_2010 by gender by sector_2010
/cells count min max mean stddev.
SPSS MEANS - Multiple Metric Variables in One Table
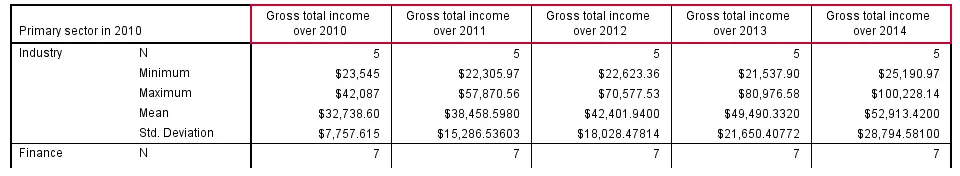
Multiple metric variables may be specified before the BY keyword (possibly using TO) as shown in the syntax below.If you reproduce this table, note that some of the results are wildly incorrect because we failed to specify user missing values for income_2012. This results in one MEANS table with the metric variables as columns.
Statistics and one or more row variables define rows in this case as shown in the following screenshot. If this structure is not to your liking, you may prefer using separate MEANS commands for separate tables instead.
means income_2010 to income_2014 by sector_2010
/cells count min max mean stddev.
SPSS MEANS - Multiple Tables
Specifying multiple variables after the BY keyword results in multiple tables with the same columns but different (categorical) row variables. The syntax below gives an example.
means income_2010 by sector_2010 to sector_2014
/cells count min max mean stddev.
SPSS MEANS - Final Note
Our discussion of MEANS is by no means exhaustive; you may consult the command syntax reference for more options. We deliberately skipped the STATISTICS subcommand because it doesn't provide any options for evaluating the essential assumptions that underlie statistical significance tests.
THIS TUTORIAL HAS 5 COMMENTS:
By Nicola on February 4th, 2019
Hi Ruben, is it possible to produce a table with means and other statistics for multiple response? Thank you so much!
By Ruben Geert van den Berg on February 4th, 2019
Hi Nicola!
I think CTABLES can do so. However, I don't use multiple response variables so I can't tell for sure.
Thanks!
Ruben
By Stephen on May 24th, 2019
Please I'm using SPSS v22 and I want to know how to compute mean for several variables as one. I mean I want the Overall mean for let's say 10 variables. Please help me out
By Ruben Geert van den Berg on May 24th, 2019
Hi Stephen!
Read up on How to Compute Means in SPSS?
Hope that helps!
SPSS tutorials
By Eze S on September 5th, 2019
The post is very useful. Thanks so much.