
Running VARSTOCASES is often necessary for generating nice charts in SPSS. One of the many examples is a stacked bar chart for comparing multiple variables. Sadly, we lose our variable labels when running VARSTOCASES and we really do need those.
The solution is a simple tool that generates our VARSTOCASES for us and applies the variable labels of the input variables as value labels to the newly created index variable.
SPSS VARSTOCASES Problem - Example
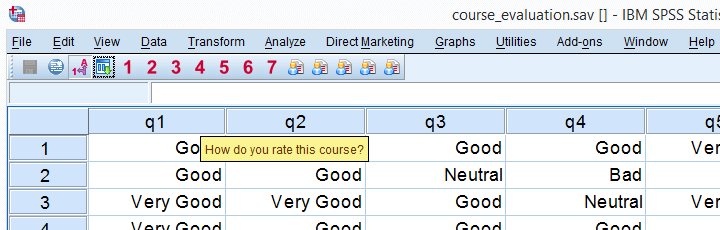
Before proposing our solution, let's first take a look at the problem. We'll use course_evaluation.sav, part of which is shown below.
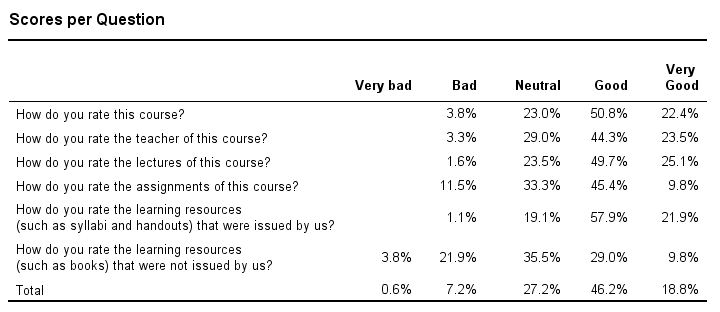
Now let's say we'd like to create the overview table shown below, perhaps followed up by a nice chart. The way to go here is VARSTOCASES as we'll demonstrate in a minute.
Desired End Result
Quick Data Check before VARSTOCASES
Whenever running VARSTOCASES, we always need to make sure our input variables have consistent value labels as explained in VARSTOCASES - wrong results. We'll check that by running the syntax below.
Inspecting Consistency of Value Labels Syntax
set tnumbers both.
*2. Check if value labels are consistent over variables.
frequencies q1 to q6.
*Result: consistent labels, good to go.
Right, we now run a basic VARSTOCASES command followed by CROSSTABS for comparing the scores on our 6 input variables in a single table.
Creating an Overview Table Syntax
varstocases/make q from q1 to q6/index question (q).
*2. Show only labels in output for reporting.
set tnumbers labels tvars labels.
*3. Create table.
crosstabs question by q/cells row.
Result
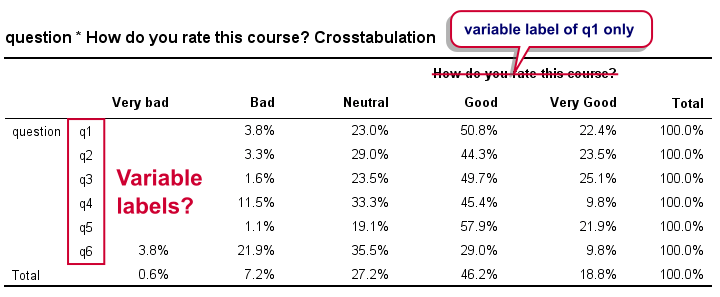
Right. Now, the numbers in this table are correct but we find it very annoying that we lost the variable labels for q2 to q6 in the process. By default, the variable label for q1 is -incorrectly- applied to our newly created variable that now holds the values of q1 to q6. It's precisely these two problems that our tool takes care of.
VARSTOCASES with Labels Tool - How to Use It?
- This tool requires SPSS version 17 or higher with the SPSS Python Essentials properly installed.
- Download and install the VARSTOCASES with labels tool. Note that this is an SPSS custom dialog.
- Navigate to
 .
. - Enter the input variables. Note that you can use the TO and ALL keywords for doing so.
- and run the syntax.
- directs your web browser to the tutorial you're currently reading.
VARSTOCASES with Labels Tool - Just Do It
If you already ran VARSTOCASES on course_evaluation.sav, then you'll need to reopen the original data. After installing the tool, you'll find it under in the menu. Fill it out as shown below.
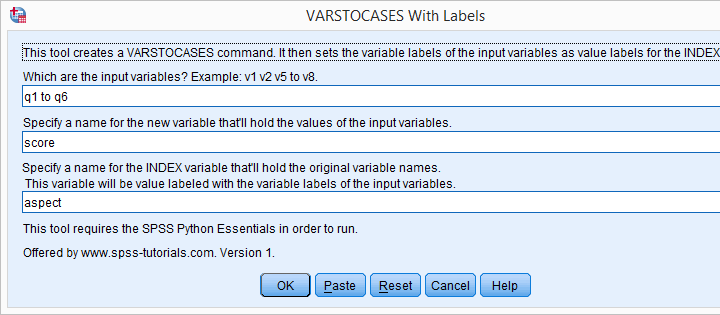
Clicking results in the syntax below.
VARSTOCASES Syntax Generated by Tool
dataset close all.
new file.
get file 'course_evaluation.sav'.
*2. SPSS Python syntax pasted from tool.
begin program.
varSpec = 'q1 to q6'
import spssaux,spss
vallabcmd = 'value labels aspect'
sDict = spssaux.VariableDict(caseless = True)
varList = sDict.expand(varSpec)
for var in varList:
vallabcmd += "\n'%s' '%s'"%(var.lower(),sDict[var].VariableLabel)
spss.Submit('''
varstocases/make score '' from q1 to q6/index aspect(score).
compute aspect = lower(aspect).
''')
spss.Submit(vallabcmd + '.')
end program.
Generating a Nice Overview Table
After running the previous example, we're good to go. We'll now create a nice overview table of q1 to q6 by running the syntax below.
variable labels q "Answer Category".
*2. Generate table.
crosstabs question by q/cells row.
Result
Final Notes
Our final table can also be created with CTABLES but not all SPSS users have a license for it. Alternatively, TABLES can do the trick but it's available only from (rather challenging) syntax which is no longer documented.
In our daily work, we routinely use this tool for creating charts rather than tables. One example, the stacked bar chart will be discussed in next week’s tutorial.
THIS TUTORIAL HAS 8 COMMENTS:
By Ruben Geert van den Berg on April 8th, 2023
Hi Srdjan!
Try installing it via
Extensions - Utilities - Install Custom Dialog (Compatibility Mode)
Hope that helps!
Ruben
SPSS tutorials
By Amirul Hasan on November 28th, 2023
Its nice, but i believe it is only for creating 1 varstocases variable, what, if we need to create 2 or more than 2 varstocases variables.
Please suggest.
Thank!
By Ruben Geert van den Berg on November 29th, 2023
Hi Amirul!
I'm not sure if there's any good solution for that.
What you could try, is to stack all variables (even different series) into a single variable with the tool.
Next, unstack each series with CASESTOVARS. This copies all value labels onto the newly created variables but not all values should appear in each new variable so that's probably no problem.
Or -perhaps- ignore the tool altogether and first create an ADD VALUE LABELS syntax for the variables you'd like to stack?
Hope that helps!
Ruben
SPSS tutorials