Introduction & Practice Data File
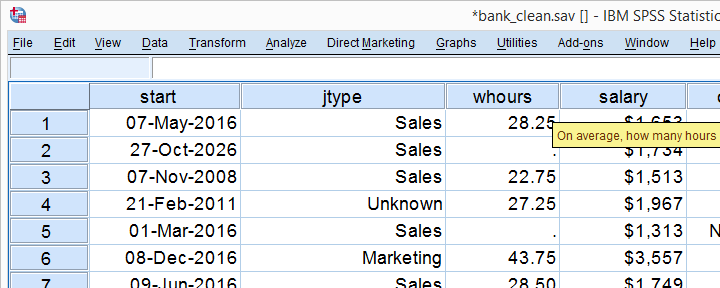
Among the very best SPSS practices is running histograms over your quantitative variables. Doing so is a super fast way to detect problems such as extreme values and gain a lot of insight into your data. This tutorial quickly walks you through using bank-clean.sav, part of which is shown below.
Option 1: FREQUENCIES without Frequency Tables
If you're running a data inspection without any need for pretty charts, then the easiest option is running the FREQUENCIES command shown below.
frequencies salary
/format notable
/histogram.
*/format notable suppresses (huge) frequency tables.
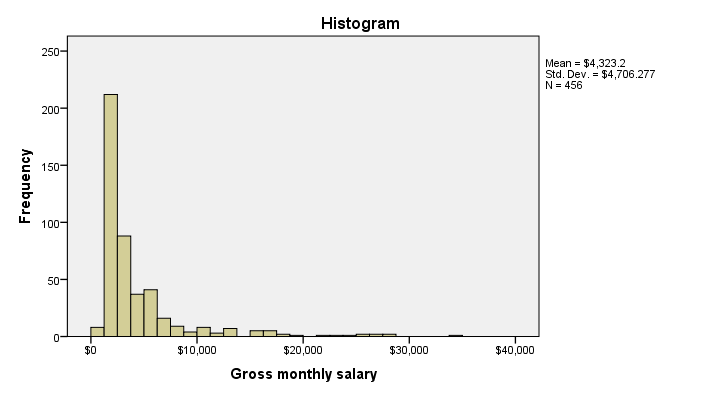
Result
Multiple Histograms in One Go
Running histograms like this does not allow you to use custom titles for your charts. However, it does allow running many histograms in one go as shown below. Oddly, doing so results in variable labels being used as chart titles instead of “Histogram” in our first example.
frequencies whours to overall
/format notable
/histogram.
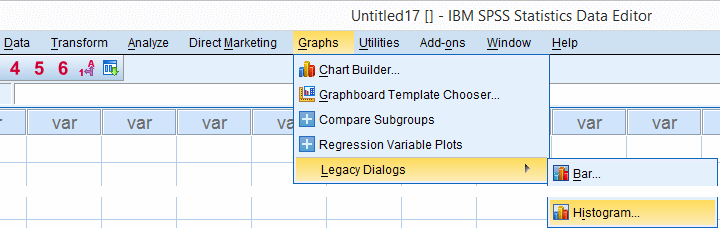
Option 2: GRAPH
If you'd like to include one or more histograms in your report, you probably need somewhat prettier charts. Creating a GRAPH command from the menu -as shown below- allows us to set nice custom titles and makes it easier to style our charts with an SPSS chart template.
SPSS dialogs for charts contain way more charts than most users are aware of and generate much nicer, cleaner syntax than the .
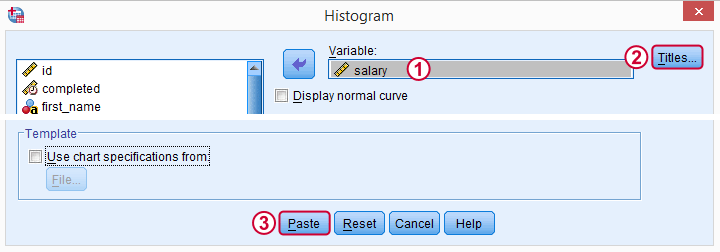
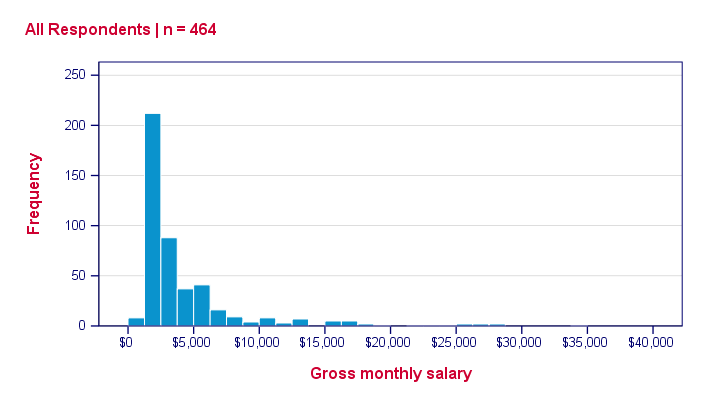
 We'll choose “All Respondents | n = 464” as our main title here because this is relevant but far from obvious.
Resulting Syntax
GRAPH
/HISTOGRAM=salary
/TITLE='All Respondents | n = 464'.
The result still looks pretty much the same. We'll fix that next.
Styling our Histogram
Last but not least, we'll style our histogram. If we save our styling as a chart template, we can easily apply it to all subsequent histograms, which may save us a lot of time. Like so, our final syntax example uses “histogram-nosum-title-720-1.sgt”. (“.sgt” is short for “SPSS Graph Template” but the file is referred to as a chart template.)
If this file is absent, SPSS will throw a warning and still run our histogram with whatever default template -if any- has been set.
SPSS Histogram Syntax with Template
GRAPH
/HISTOGRAM=salary
/TITLE='All Respondents | n = 464'
/template 'histogram-nosum-title-720-1.sgt'.
Final Result
So that's basically it. We could discuss some more options but we don't find them useful in practice, so we'd rather keep it short this time.
We hope you found this tutorial helpful. Thanks for reading!
THIS TUTORIAL HAS 7 COMMENTS:
By Jeff Boggs on November 21st, 2017
Thank you for this handy tutorial in particular, and maintaining this website more generally.
Do you know if the chart names are (e.g., 'histogram-nosum-title-720-1.sgt') are fairly consistent across versions of SPSS?
Alternately, is the TEMPLATE command fairly consistent across versions of SPSS? I'm using version 24.
By Ruben Geert van den Berg on November 22nd, 2017
Hi Jeff!
SET CTEMPLATE ... has been around for a long, long time.
Most SPSS chart templates have hardly changed over the years but most are pretty crappy too. For really nice charts, create your own templates. The histogram-nosum-title-720-1.sgt template you mention is one of the templates I created myself.
I should add that SPSS 25 has much nicer charts than all previous versions but I think they're still not really good. For a quick overview, see New Charts in SPSS 25: How Good Are They Really?.
Hope that helps!
By Jeff Boggs on November 22nd, 2017
Hi Rubert,
Thank you for the rapid reply. I have two more questions, if you have the time:
1. I've also been looking into GPL options for making more attractive, standardized charts, though am loathe to learn yet another language if it is not widely used. Do you know if GPL is used in STATA or R? Or is at least compatible with those programs?
2. If one uses the SPSS Chart Editor, is there a way to paste the syntax for a histogram after you've reset all the parameters such as binning, minimum value, maximum value and color? So far, all I have seen are instructions for how to PASTE the basic syntax instead of selecting OK. I, however, would prefer to access the syntax for the chart AFTER I have made it prettier.
I ask these questions because in our current project we need to produce over 100 figures, and I want to insure now that we have a procedure in place for standardizing the format BEFORE we start producing the figures (i.e., histograms, tables, bar charts, scatterplots).
Again, your website is a godsend. Thank you for maintaining it.
Best regards,
Jeff
By Ruben Geert van den Berg on November 22nd, 2017
Hi Jeff!
1. Don't learn GPL unless you really need to create charts that can't be created otherwise. Learning GPL is time consuming and not overly rewarding -a lot of stuff that should work, just doesn't.
2. First create one chart from the legacy dialogs syntax. Style the chart and save its styling as an SPSS chart template. Then use SET CTEMPLATE ... and run all similar chart types. Repeat this procedure for each type of chart.
Note that chart templates are plain text files in .xml format so you can edit them in Notepad++ if you master some XML. This will result in much better chart templates than using the Chart Editor for styling.
If you need any personal assistance on that, let me know. I've tons of experience with this.
By Assipee on November 25th, 2018
How do you enter grouped data to obtain a histogram, ogive, bar and pie charts from a grouped frequency distribution in SPSS?