A nasty limitation of SPSS is that some commands take only one variable. Now, DO REPEAT and LOOP allow us to loop over variables but they are limited to SPSS transformation commands.
Python, however, allows us to loop over any command. On top of that, we can use the TO keyword, thus circumventing the need to spell out all variable names.
This lesson -covering both techniques- is among the most important of this course. Let's dive in!
Population Pyramids
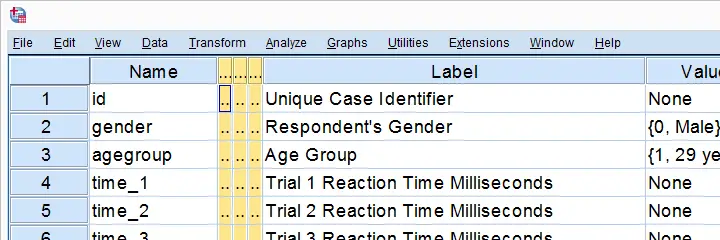
We previously cleaned up some reaction time data and this resulted in trials-renamed.sav, part of which is shown below.

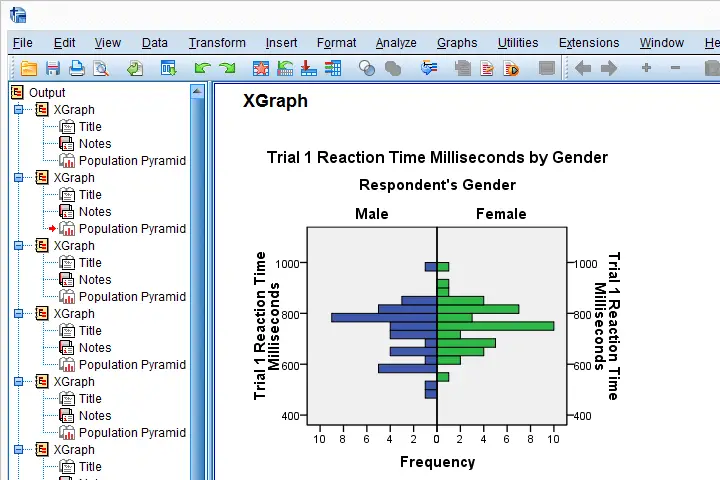
We'd now like to visualize the performance of our female versus male participants. A great way for doing so is running population pyramids. They allow for a “quick and dirty” comparison of
- means,
- standard deviations,
- skewnesses,
- outliers
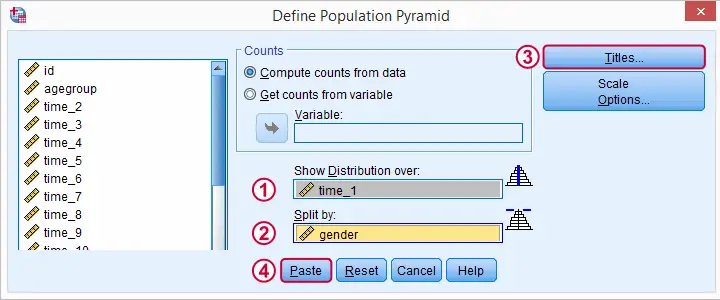
and so on between males and females. We'll first just create one by following the screenshots below.


SPSS Population Pyramid Syntax
XGRAPH CHART=[HISTOBAR] BY time_1[s] BY gender[c]
/COORDINATE SPLIT=YES
/BIN START=AUTO SIZE=AUTO
/TITLES TITLE='Reaction Time by Gender'.
Apparently, we need 4 lines of syntax for one population pyramid and we'd like to have a quick peek at 20 of them.Admittedly, we could shorten the syntax somewhat but let's not waste time on it. So we need at least 80 lines of syntax. Right?
Expanding SPSS’ TO Keyword
Wrong. As in previous lessons, we'll have Python loop over this command and use a different variable name in each iteration. In this case, our reaction time variables have such simple names that we can generate all of them with a Python list comprehension like ["time_%s"%ind for ind in range(1,21)] But what about variable names that don't follow such a simple pattern? In SPSS, we'll usually specify a block of variables with the first and last variable names separated by SPSS’ TO keyword. Additional variables may be added, separated by spaces as in time_1 time_3 to time_6 time_8 time_12 Python can expand this SPSS variable specification into a Python list of variable names. This is among the most important SPSS Python techniques and it's demonstrated below.
begin program python3.
import spssaux
sDict = spssaux.VariableDict(caseless = True)
varList = sDict.expand("tiME_1 to time_20")
print(varList)
end program.
Note: since Python is case sensitive, we often need to use the correct casing for variable names and any other SPSS objects. For VariableDict(), however, adding caseless = True allows us to use any casing we like, which is usually all lowercase.
Running our Population Pyramids
We can now use a simple Python for loop for iterating over our XGRAPH commands. In each iteration, Python replaces %s with a variable name. This gets our job done.
begin program python3.
import spssaux,spss
sDict = spssaux.VariableDict(caseless = True)
varList = sDict.expand("time_1 to time_20")
for var in varList:
spss.Submit('''
XGRAPH CHART=[HISTOBAR] BY %s[s] BY gender[c]
/COORDINATE SPLIT=YES
/BIN START=AUTO SIZE=AUTO
/TITLES TITLE='Reaction Time by Gender'.
'''%var)
end program.
Result

Insert Variable Labels into Titles
We got our basic job done. However, we'll now insert our variable labels into our chart titles. Now,
spss.GetVariableLabel()
can retrieve variable labels by variable indices. For getting variable labels by variable names, however, the aforementioned VariableDict() object comes in handy (line 8, below).
In our final example, we have two text replacements in each XGRAPH command. When using multiple text replacements, using locals() is often a nice way to get things done.
begin program python3.
import spssaux,spss
sDict = spssaux.VariableDict(caseless = True)
varList = sDict.expand("time_1 to time_20")
for var in varList:
varLab = sDict[var].VariableLabel
spss.Submit('''
XGRAPH CHART=[HISTOBAR] BY %(var)s[s] BY gender[c]
/COORDINATE SPLIT=YES
/BIN START=AUTO SIZE=AUTO
/TITLES TITLE='%(varLab)s by Gender'.
'''%locals())
end program.
So I guess that'll do for this lesson. If you've any feedback, please let us know.
Hope you found it helpful!
 SPSS TUTORIALS