Null Hypothesis
The null hypothesis for a repeated measures ANOVA is that 3(+) metric variables have identical means in some population.
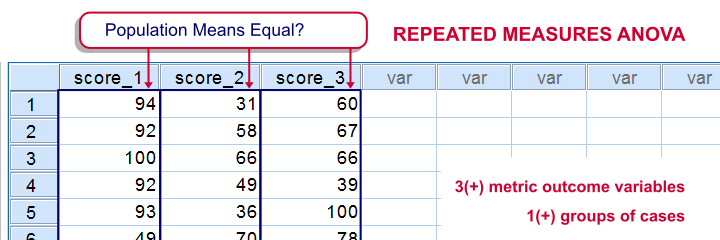
The variables are measured on the same subjects so we're looking for within-subjects effects (differences among means). This basic idea is also referred to as dependent, paired or related samples in -for example- nonparametric tests.
But anyway: if all population means are really equal, we'll probably find slightly different means in a sample from this population. However, very different sample means are unlikely in this case. These would suggest that the population means weren't equal after all.
Repeated measures ANOVA basically tells us how likely our sample mean differences are if all means are equal in the entire population.
Repeated Measures ANOVA - Assumptions
- Independent observations or, precisely, Independent and identically distributed variables;
- Normality: the test variables follow a multivariate normal distribution in the population;
- Sphericity: the variances of all difference scores among the test variables must be equal in the population. Sphericity is sometimes tested with Mauchly’s test. If sphericity is rejected, results may be corrected with the Huynh-Feldt or Greenhouse-Geisser correction.
Repeated Measures ANOVA - Basic Idea
We'll show some example calculations in a minute. But first: how does repeated measures ANOVA basically work? First off, our outcome variables vary between and within our subjects. That is, differences between and within subjects add up to a total amount of variation among scores. This amount of variation is denoted as SStotal where SS is short for “sums of squares”.
We'll then split our total variance into components and inspect which component accounts for how much variance as outlined below. Note that “df” means “degrees of freedom”, which we'll get to later.
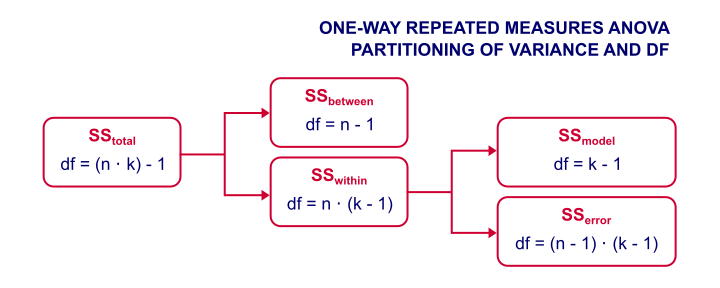
Now, we're not interested in how the scores differ between subjects. We therefore remove this variance from the total variance and ignore it. We're then left with just SSwithin (variation within subjects).
The variation within subjects may be partly due to our variables having different means. These different means make up our model. SSmodel is the amount of variation it accounts for.
Next, our model doesn't usually account for all of the variation between scores within our subjects. SSerror is the amount of variance that our model does not account for.
Finally, we compare two sources of variance: if SSmodel is large and SSerror is small, then variation within subjects is mostly due to our model (consisting of different variable means). This results in a large F-value, which is unlikely if the population means are really equal. In this case, we'll reject the null hypothesis and conclude that the population means aren't equal after all.
Repeated Measures ANOVA - Basic Formulas
We'll use the following notation in our formulas:
- \(n\) denotes the number of subjects;
- \(k\) denotes the number of variables;
- \(Xij\) denotes the score of subject \(i\) on variable \(j\);
- \(Xi.\) denotes the mean for subject \(i\);
- \(X.j\) denotes the mean of variable \(j\);
- \(X..\) denotes the grand mean.
Now, the formulas for the sums of squares, degrees of freedom and mean squares are
$$SS_{within} = \sum_{i=1}^n\sum_{j=1}^k(Xij - Xi.)^2$$
$$SS_{model} = n \sum_{j=1}^k(X.j - X..)^2$$
$$SS_{error} = SS_{within} - SS_{model}$$
$$df_{model} = k - 1$$
$$df_{error} = (k - 1)\cdot(n - 1)$$
$$MS_{model} = \frac{SS_{model}}{df_{model}}$$
$$MS_{error} = \frac{SS_{error}}{df_{error}}$$
$$F = \frac{MS_{model}}{MS_{error}}$$
Repeated Measures ANOVA - Example
We had 10 people perform 4 memory tasks. The data thus collected are listed in the table below. We'd like to know if the population mean scores for all four tasks are equal.
| Subject | task1 | task2 | task3 | task4 | Subject Mean |
|---|---|---|---|---|---|
| 1 | 8 | 7 | 6 | 7 | 7 |
| 2 | 5 | 8 | 5 | 6 | 6 |
| 3 | 6 | 5 | 3 | 4 | 4.5 |
| 4 | 6 | 6 | 7 | 3 | 5.5 |
| 5 | 8 | 10 | 8 | 6 | 8 |
| 6 | 6 | 5 | 6 | 3 | 5 |
| 7 | 6 | 5 | 2 | 3 | 4 |
| 8 | 9 | 9 | 9 | 6 | 8.25 |
| 9 | 5 | 4 | 3 | 7 | 4.75 |
| 10 | 7 | 6 | 6 | 5 | 6 |
| Variable Mean | 6.6 | 6.5 | 5.5 | 5 | 5.9 (grand mean) |
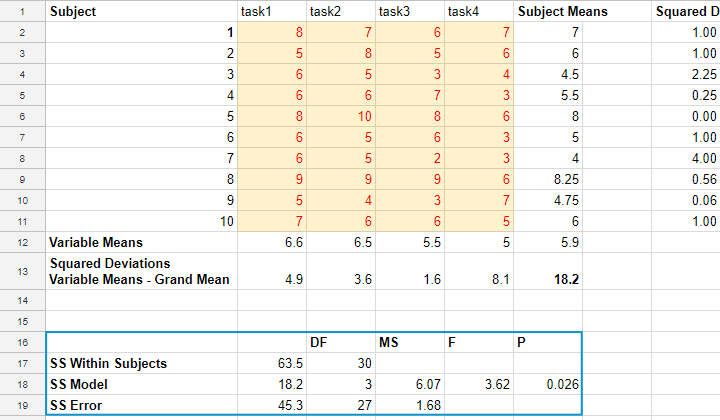
If we apply our formulas to our example data, we'll get
$$SS_{within} = (8 - 7)^2 + (7 - 7)^2 + ... + (5 - 6)^2 = 63.5$$
$$SS_{model} = 10 \cdot((6.6 - 5.9)^2 + (6.5 - 5.9)^2 + (5.5 - 5.9)^2 + (5 - 5.9)^2) = 18.2$$
$$SS_{error} = 63.5 - 18.2 = 45.3$$
$$MS_{model} = \frac{18.2}{3} = 6.07$$
$$MS_{error} = \frac{45.3}{27} = 1.68$$
$$F = \frac{6.07}{1.68} = 3.62$$
$$P(F(3,27) > 3.62) \approx 0.026$$
The null hypothesis is usually rejected when p < 0.05. Conclusion: the population means probably weren't equal after all.
Repeated Measures ANOVA - Software
We computed the entire example in the Googlesheet shown below. It's accessible to all readers so feel free to take a look at the formulas we use.
Although you can run the test in a Googlesheet, you probably want to use decent software for running a repeated measures ANOVA. It's not included in SPSS by default unless you have the advanced statistics option installed. An outstanding example of repeated measures ANOVA in SPSS is SPSS Repeated Measures ANOVA.
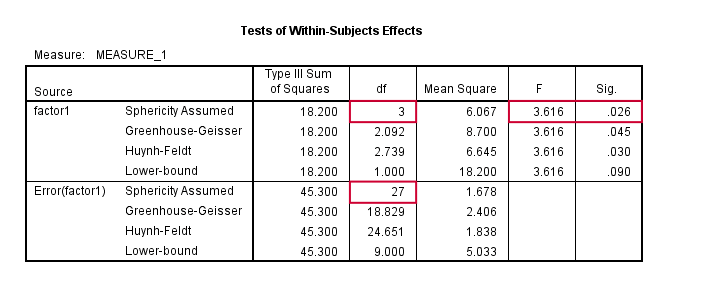
The figure below shows the SPSS output for the example we ran in this tutorial.
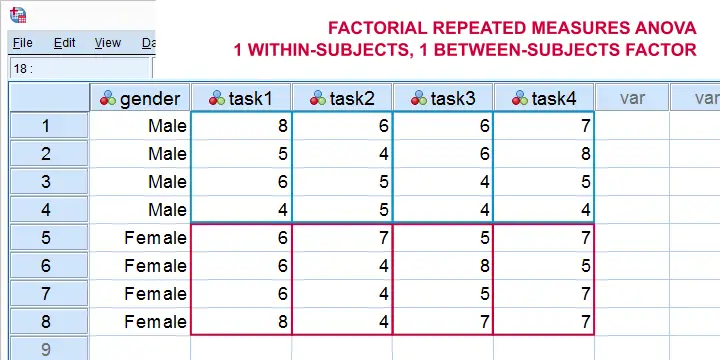
Factorial Repeated Measures ANOVA
Thus far, our discussion was limited to one-way repeated measures ANOVA with a single within-subjects factor. We can easily extend this to a factorial repeated measures ANOVA with one within-subjects and one between-subjects factor. The basic idea is shown below. For a nice example in SPSS, see SPSS Repeated Measures ANOVA - Example 2.
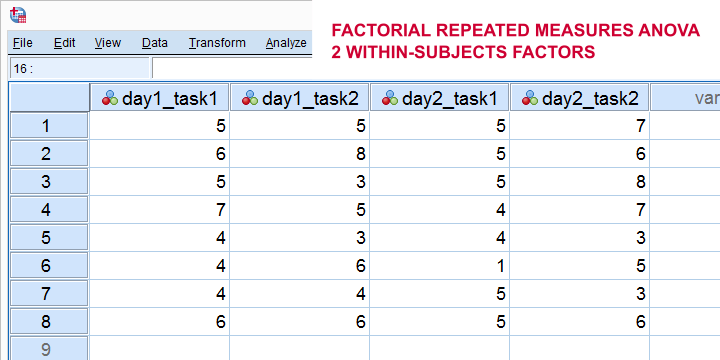
Alternatively, we can extend our model to a factorial repeated measures ANOVA with 2 within-subjects factors. The figure below illustrates the basic idea.
Finally, we could further extend our model into a 3(+) way repeated measures ANOVA. (We speak of “repeated measures ANOVA” if our model contains at least 1 within-subjects factor.)
Right, so that's about it I guess. I hope this tutorial has clarified some basics of repeated measures ANOVA.
Thanks for reading!
THIS TUTORIAL HAS 2 COMMENTS:
By Prerana on April 7th, 2019
Hi,
How do you carry out a 4 way mixed anova?
By thavorn on August 12th, 2019
I love to learn spss Repeated Anova, Iwould like to have data so I can understand and how to analyse it corredctly please.