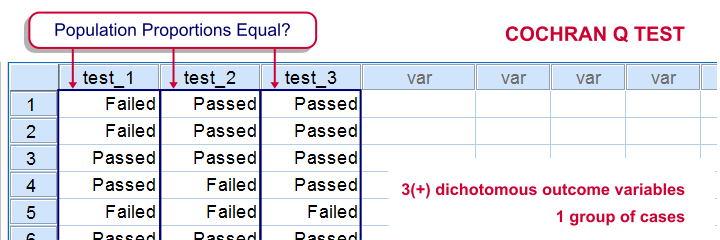
SPSS Cochran Q test is a procedure for testing if the proportions of 3 or more dichotomous variables are equal in some population. These outcome variables have been measured on the same people or other statistical units.
SPSS Cochran Q Test Example
The principal of some university wants to know whether three exams are equally difficult. Fifteen students took these exams and their results are in exam-results.sav.
1. Quick Data Check
It's always a good idea to take a quick look at what the data look like before proceeding to any statistical tests. We'll open the data and inspect some histograms by running FREQUENCIES with the syntax below. Note the TO keyword in step 3.
cd 'd:downloaded'. /*or wherever data file is located.
*2. Open data.
get file 'exam-results.sav'.
*3. Quick check.
frequencies test_1 to test_3
/format notable
/histogram.

The histograms indicate that the three variables are indeed dichotomous (there could have been some “Unknown” answer category but it doesn't occur). Since N = 15 for all variables, we conclude there's no missing values. Values 0 and 1 represent “Failed” and “Passed”.We suggest you RECODE your values if this is not the case. We therefore readily see that the proportions of students succeeding range from .53 to .87.
2. Assumptions Cochran Q Test
Cochran's Q test requires only one assumption:
- independent observations (or, more precisely, independent and identically distributed variables);
3. Running SPSS Cochran Q Test


We'll navigate to
![]()
![]()
![]()
 We move our test variables under ,
 select under ,
 select under and
 click
click
This results in the syntax below which we then run in order to obtain our results.
NPAR TESTS
/COCHRAN=test_1 test_2 test_3
/STATISTICS DESCRIPTIVES
/MISSING LISTWISE.
4. SPSS Cochran Q Test Output

The first table (Descriptive Statistics) presents the descriptives we'll report. Do not report the results from DESCRIPTIVES instead.The reason is that the significance test is (necessarily) based on cases without missing values on any of the test variables. The descriptives obtained from Cochran's test are therefore limited to such complete cases too.
Since N = 15, the descriptives once again confirm that there are no missing values and
the proportions range from .53 to .87.Again, proportions correspond to means if 0 and 1 are used as values.

The table Test Statistics presents the result of the significance test.
The p-value (“Asymp. Sig.”) is .093; if the three tests really are equally difficult in the population, there's still a 9.3% chance of finding the differences we observed in this sample. Since this chance is larger than 5%, we do not reject the null hypothesis that the tests are equally difficult.
5. Reporting Cochran's Q Test Results
When reporting the results from Cochran's Q test, we first present the aforementioned descriptive statistics. Cochran's Q statistic follows a chi-square distribution so we'll report something like “Cochran's Q test did not indicate any differences among the three proportions, χ2(2) = 4.75, p = .093”.
THIS TUTORIAL HAS 6 COMMENTS:
By Swandito Septianto on January 20th, 2015
i have ran Cochran's Q test for my research which involved 40 respondent (N=40), mean is .95 . on the "Test Statistics" table, found that "Cochran's Q" is at .000a, "df" is at 3 and "Asmp. Sig." is at 1.000 . from those resulted. Please explain me if the p-value is at 1.000. Thanks
By Ruben Geert van den Berg on January 21st, 2015
Yes, that is entirely correct: "sig." denotes "significance", which is used interchangeably with "p-value". Did you inspect your descriptives? The results suggests that all proportions are exactly equal.
By Yowie on July 20th, 2016
Since Cochran's Q test is somehow extension of McNemar's test, shouldnt it provide same result (sig.) if you use Cochran's Q test and put in 2 samples?
I do not know if i am doing smt wrong bc i get different results.
By Ruben Geert van den Berg on July 21st, 2016
Hi Yowie, great question! I'll have to look it up and I'll try to do so today and get back to you later, ok?
For now, I believe Cochran's Q test is not an extension of McNemar's test as the latter involves simpler calculations (which were a real issue in the era these tests were developed). My guess is that McNemar's test is a bit more accurate and therefore tends to come up with slightly lower p-values but I'll need to try that out.
I should add that your reasoning does hold for one-way ANOVA versus the independent samples t test and similar examples. In fact, text books could completely skip the latter test since it's redundant. We actually considered doing just that on our website but it would probably confuse and dissatisfy our visitors.
By yowie on July 25th, 2016
Thank you for your effort to explain this differencess. However, i get lower p-values with Cochran's Q test...here is my data and output:
A,1,1,0,0,1,0,1,1,1,1,1,1,1,1,1,0,1,1,1,1,0,1,1,1,1,1,0,1,1,1,1,1,0,0,0,1
B,1,1,0,0,1,0,1,1,0,0,0,0,0,1,0,0,1,0,1,1,1,0,1,1,0,1,1,1,1,1,1,1,0,0,0,1
Test Statisticsa
A & B
N 36
Exact Sig. (2-tailed) .065b
a McNemar Test
b Binomial distribution used.
Test Statistics
N 36
Cochran's Q 4.455a
df 1
Asymp. Sig. .035
a 1 is treated as a success.
Thank you!