Introduction & Practice Data File
When running correlations in SPSS, we get the p-values as well. In some cases, we don't want that: if our data hold an entire population, such p-values are actually nonsensical. For some stupid reason, we can't get correlations without significance levels from the correlations dialog. However, this tutorial shows 2 ways for getting them anyway. We'll use adolescents-clean.sav throughout.
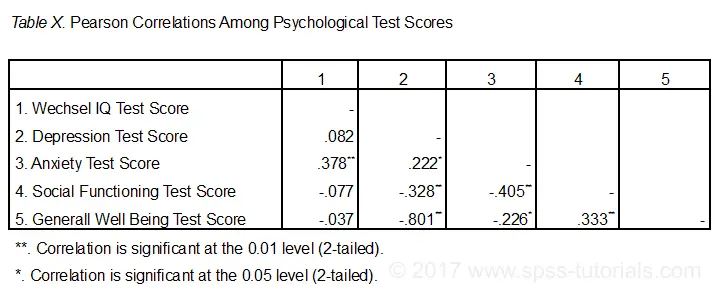 Correlation Table as Recommended by the APA
Option 1: FACTOR
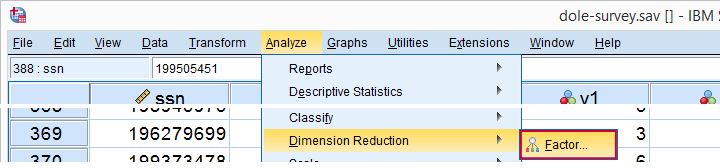
A reasonable option is navigating to
![]()
![]() as shown below.
as shown below.
Next, we'll move iq through wellb into the variables box and follow the steps outlines in the next screenshot.
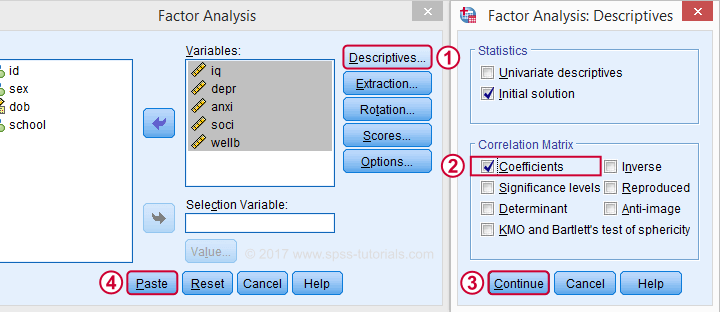
Clicking results in the syntax below. It'll create a correlation matrix without significance levels or sample sizes. Note that FACTOR uses listwise deletion of missing values by default but we can easily change this to pairwise deletion. Also, we can shorten the syntax quite a bit in case we need more than one correlation matrix.
Correlation Matrix from FACTOR Syntax
FACTOR
/VARIABLES iq depr anxi soci wellb
/MISSING pairwise /* WATCH OUT HERE: DEFAULT IS LISTWISE! */
/ANALYSIS iq depr anxi soci wellb
/PRINT CORRELATION EXTRACTION
/CRITERIA MINEIGEN(1) ITERATE(25)
/EXTRACTION PC
/ROTATION NOROTATE
/METHOD=CORRELATION.
*Can be shortened to...
factor
/variables iq to wellb
/missing pairwise
/print correlation.
*...or even...
factor
/variables iq to wellb
/print correlation.
*but this last version uses listwise deletion of missing values.
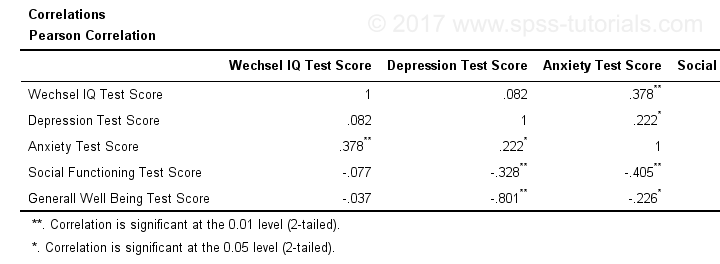
Result
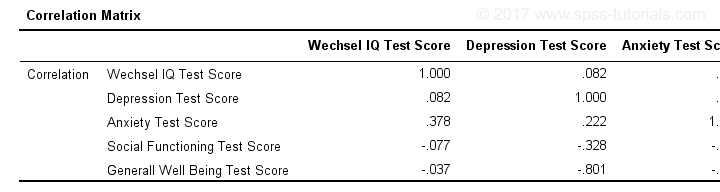
When using pairwise deletion, we no longer see the sample sizes used for each correlation. We may not want those in our table but perhaps we'd like to say something about them in our table title.
More importantly, we've no idea which correlations are statistically significant and which aren't. Our second approach deals nicely with both issues.
Option 2: Adjust Default Correlation Table
The fastest way to create correlations is simply running correlations iq to wellb. However, we sometimes want to have statistically significant correlations flagged. We'll do so by adding just one line.
correlations iq to wellb
/print nosig.
This results in a standard correlation matrix with all sample sizes and p-values. However, we'll now make everything except the actual correlations invisible.
Adjusting Our Pivot Table Structure
We first right-click our correlation table and navigate to
![]() as shown below.
as shown below.
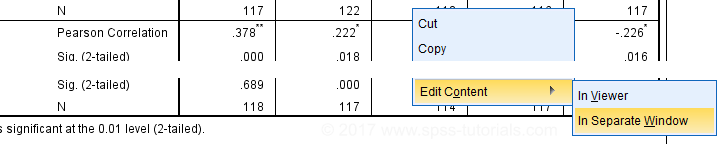
Select from the menu.
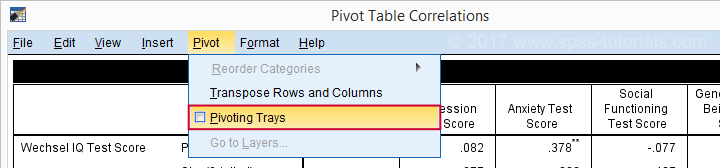
Drag and drop the Statistics (row) dimension into the LAYER area and close the pivot editor.
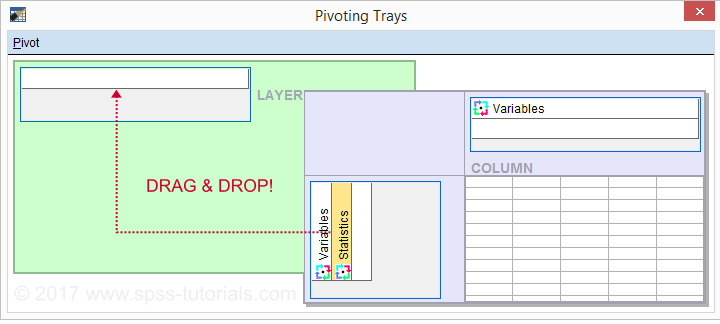
Result
Same Results Faster?
If you like the final result, you may wonder if there's a faster way to accomplish it. Well, there is: the Python syntax below makes the adjustment on all pivot tables in your output. So make sure there's only correlation tables in your output before running it. It may crash otherwise.
begin program.
import SpssClient
SpssClient.StartClient()
oDoc = SpssClient.GetDesignatedOutputDoc()
oItems = oDoc.GetOutputItems()
for index in range(oItems.Size()):
oItem = oItems.GetItemAt(oItems.Size() - index - 1)
if oItem.GetType() == SpssClient.OutputItemType.PIVOT:
pTable = oItem.GetSpecificType()
pManager = pTable.PivotManager()
nRows = pManager.GetNumRowDimensions()
rDim = pManager.GetRowDimension(0)
rDim.MoveToLayer(0)
SpssClient.StopClient()
end program.
Well, that's it. Hope you liked this tutorial and my script -I actually run it from my toolbar pretty often.
Thanks for reading!
THIS TUTORIAL HAS 13 COMMENTS:
By Ruben Geert van den Berg on February 19th, 2018
Hi Jitendra!
Perhaps read up on Correlation Coefficient - What Is It?.
Apart from that, I agree I could write a bit more about the interpretation, especially the caveats. I'll try and cover some good cases on that but it may take some months since I'm very full right now.
By Ahmed on June 14th, 2018
am searching help towards APA correlation analysis
By Ruben Geert van den Berg on June 14th, 2018
Hi Ahmed!
Try SPSS Correlation Analysis.
Hope that helps!
By ELMER ONGUS on June 20th, 2018
This is a very significant elaboration. Kindly indicate also how someone can come out with the stairs format. I have really tried it and its now working out for me
By Ruben Geert van den Berg on June 20th, 2018
Hi Elmer!
Do you mean only subdiagonal elements by "stairs format"? Do you have an example (screenshot) you could share with me? Thanks!