- Inspect Frequency Table
- Extract Leading Digits
- Inspect Which Values Couldn't be Converted
- Inspect Final Results
Recently, one of our clients used a text field for asking his respondents’ ages. The resulting age variable is in age-in-string.sav, partly shown below.
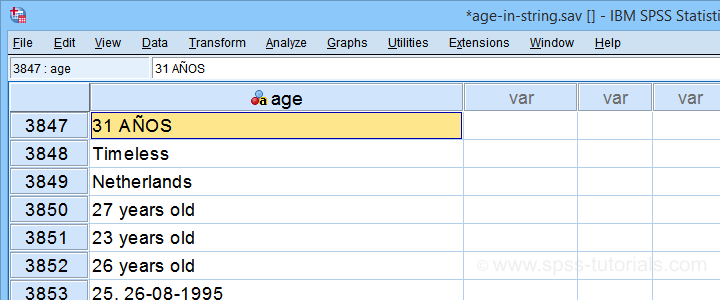
I hope you realize that this looks nasty:
- age is a string variable so we can't compute its mean, standard deviation or any other statistic;
- we can't readily convert age into a numeric variable because it contains more than just numbers;
- a simple text replacement won't remove all such undesired characters.
For adding injury to insult, the data contain 3,895 cases so doing things manually is not feasible. However, we'll quickly fix things anyway.
Inspect Frequency Table
Let's first see which problematic values we're dealing with anyway. So let's run a basic frequency table with the syntax below.
frequencies age
/format dfreq.
Result
If we scroll down our table a bit, we'll see some problematic values as shown below.
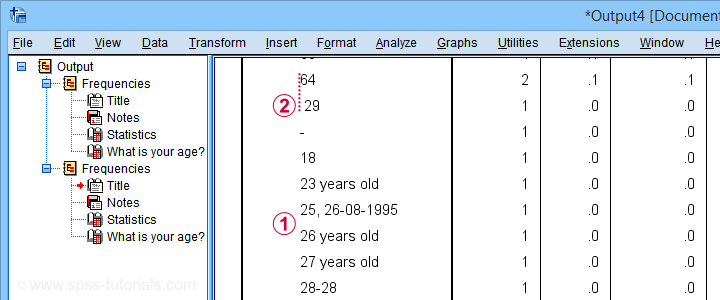
This table shows us 2 important things:
 most values that can be corrected start off with 2 digits;
 at least one value is preceded by a leading space.
Let's first remove any leading spaces. We'll simply do so by running compute age = ltrim(age).
Extract Leading Digits
We'll now extract any leading digits from our string variable with the syntax below.
string nage (a3).
*Loop over characters in age and pass into nage if they are digits.
loop #ind = 1 to char.length(age).
do if(char.index('0123456789',char.substr(age,#ind,1)) > 0).
compute nage = concat(rtrim(nage),char.substr(age,#ind,1)).
else.
break.
end if.
end loop.
execute.
So what we very basically do here is
- we create a new string variable;
- we LOOP through all characters in age;
- we evaluate if each character is a digit: char.index returns 0 if the character can't be found in '0123456789'.
- if the character is a digit (DO IF), we'll add it to the end of our new string variable;
- if the character is not a digit (ELSE), BREAK ends the loop for that particular respondent.
This last condition is needed for values such as “55 and will become 56 on 3/9” We need to make sure that no digits after “55” are added to our new variable. Otherwise, we'll end up with “555639” -an age perhaps only plausible for Fred Flintstone.
Inspect Which Values Couldn't be Converted
Let's now inspect which original age values could not be converted. We'll rerun our frequency distribution but we'll restrict it to respondents whose new age value is still empty.
temporary.
select if (nage = '').
*Check which age values weren't converted yet.
frequencies age
/format dfreq.
Result
Surprisingly, a quick scroll down our table shows that we can reasonably convert only a single unconverted age value: “Will become 56 on the 3rd of September:-)”
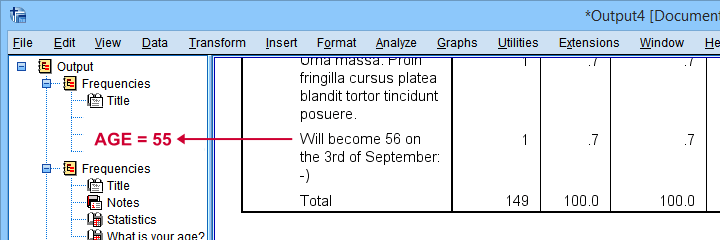
It is probably safe to infer from this statement that this person was 55 years old at questionnaire completion. We'll set his age to 55 with a simple IF command. We'll then run a quick final check.
if(char.index(age,'Will become 56') > 0) nage = '55'.
*Recheck which age values weren't converted yet.
temporary.
select if (nage = '').
frequencies age
/format dfreq.
Final Frequency Table
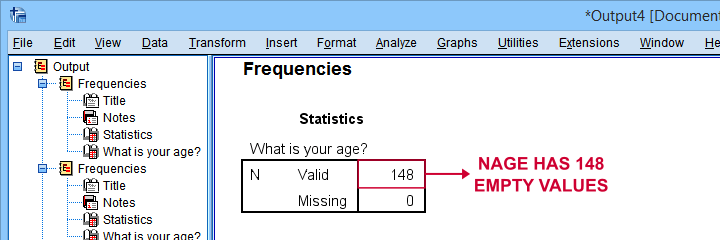
As shown below, our minimal corrections resulted in a mere 148 (out of 3,895) unconverted ages. A quick scroll down our table shows that no further conversions are possible.
We'll now convert our new age variable into numeric with ALTER TYPE and inspect the result.
alter type nage(f3).
*Check age distribution.
frequencies nage
/histogram.
*Exclude nage = 99 from all analyses and/or editing.
missing values nage (99).
Inspect Final Results
First off, note that our final age variable has N = 148 missing values -just as expected. It is important to check this because ALTER TYPE may result in missing values without throwing any error or warning.
Next, a histogram over our final age values is shown below.
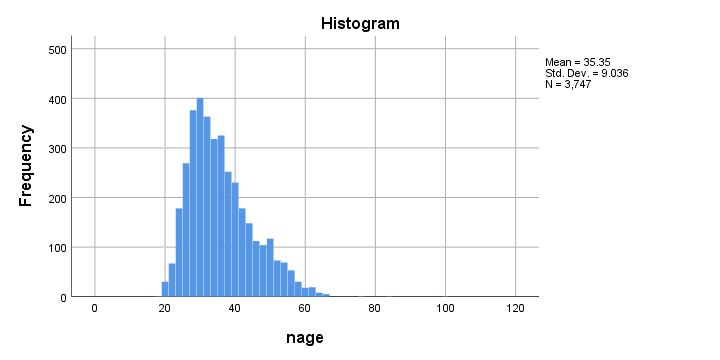
Although the age distribution looks plausible, the x-axis runs up to 120 years. SPSS often applies a 20% margin on both sides so this may indicate an age around 100 years.
Closer inspection shows that somebody reported an age of 99 years. As we think that's not plausible for the current study, we set it as a user missing value.
Done.
Thanks for reading!
THIS TUTORIAL HAS 11 COMMENTS:
By Ruben Geert van den Berg on May 19th, 2021
Hi Jon!
I finally got it working but it was a rough road.
I could neither update nor uninstall (and reinstall) SPSSINC_TRANS via the extension hub (see errors):
0 extension(s) installed, 1 extension(s) updated and 0 extension(s) uninstalled with 1 failure(s).
Could not remove extension SPSSINC_TRANS
Cannot update extension bundle to the specified location: C:\ProgramData\IBM\SPSS\Statistics\27\extensions Please restart SPSS Statistics with "Run as Administrator" and try again.
The only thing that would work, was
-downloading the .spe file from https://github.com/IBMPredictiveAnalytics/SPSSINC_TRANS/blob/master/SPSSINC_TRANS.spe
-running SPSS as an adminstrator
-overwriting the extension via Extensions -> install local extension bundle
For me, that's all good. However, I expect most of my clients and online audience to drop out during this process. Is there any way you could (have somebody) facilitate things?
I totally see the potential of SPSSINC_TRANS and I'd love to cover some examples in a tutorial (perhaps September/October since it's currently low season for the website).
Best,
Ruben
By Jon K Peck on August 28th, 2023
The posted approach uses programming logic to figure out as best as possible what the value of age is in a semistructured string variable. This can get pretty complicated in some situations. But there is a much simpler and less error prone possibility. You can use pattern-matching code. For the age examples, you could just do this - one command.
spssinc trans result=newage extra1 extra2
/formula "re.findall('\d{2,3}', age)".
I admit that this requires learning something about regular expressions, which is what is used here, but simple re's are not hard to master, and using a pattern avoids the need to think of all the possibilities as required with programming logic.
To explain:
- spssinc trans is an extension command installable via Extensions > Extension Hub if not already present.
re is a Python module in the standard library that does pattern matching. The pattern here is
"\d{2,3}"
\d matches any digit. {2,3} says we only want to see digit strings of length 2 or 3. We could just write \d+ for unlimited length, but restricting the length screens out things like a 4-digit year or a single digit.
The re.findall function returns a list of all the parts of the string that matched the pattern. I specified that the result should be three variables, so if other numeric sequences appear, they can easily be inspected in the result. If there is only one match, the other variables will be sysmis.
Googling will turn up many video or text tutorials on python regular expressions.
By Ruben Geert van den Berg on August 28th, 2023
Hi Jon!
Thanks for your valuable contribution!
I've been using RE's for many years so I did consider such an approach.
However, I wonder if I should use Python for getting done something that can reasonably be done in plain syntax too (as a general principle, just like avoiding Javascript for stuff that can be done with CSS).
Another hesitation is that I'm not sure which users have SPSSINC TRANS installed. The example came from a student who'll send his project to some supervisor so everything needs to run on 3 computers (mine, student, supervisor).
Finally, your syntax didn't entirely work on the example data:
$casenum 3840 filled out "25, 26-08-1995" for age.
This crashed your example because it returns 4 (rather than 3) output variables:
Function returned too many values. Number expected: 3
Sadly, subsequent cases weren't processed either (but at least Python threw a warning here).
Something like
spssinc trans result=n01 to n10
/formula "re.findall('\d{2,3}', age)".
is a bit safer here (and did do the job correctly).
By Jon K Peck on August 28th, 2023
spssinc trans is automatically installed with many versions of Python and can be added from the menus if it isn't.
IMO, it is better to use the best technology in terms of simplicity, readability, correctness etc, so I see no reason to avoid Python or R code with Statistics. Obviously, regular Statistics syntax will often be fine.
In fact, v29 has several important new statistical procedures created by the SPSS staff that are actually implemented in Python, but the user would never know it except for the need to pull them from the Extension Hub due to rules from IBM Legal.
I kept my example as simple as possible, but if one wanted to guard against the example that failed, it could be accommodated with only a little more complexity.
By Ruben Geert van den Berg on August 29th, 2023
Code cleanliness and readability are strong arguments for preferring Python in some cases, totally agree on that.
I didn't think the example in the tutorial was overly complex or unreadable but it's a good point.
One thing I've been wondering about is why some very essential functionality resides in extensions rather than being built into SPSS itself?
I also noticed that some extensions seem to be installed with SPSS by default but the exact selection seems to change from version to version. There doesn't happen to be some overview of which SPSS version(s) include which extensions by default, right?
When you said "it could be accommodated with only a little more complexity.", are you aiming at a try - except clause within SPSSINC TRANS?