Kendall’s Concordance Coefficient W is a number between 0 and 1
that indicates interrater agreement.
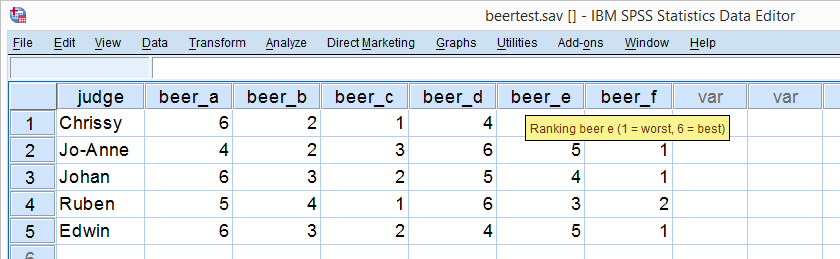
So let's say we had 5 people rank 6 different beers as shown below. We obviously want to know which beer is best, right? But could we also quantify how much these raters agree with each other? Kendall’s W does just that.
Kendall’s W - Example
So let's take a really good look at our beer test results. The data -shown above- are in beertest.sav. For answering which beer was rated best, a Friedman test would be appropriate because our rankings are ordinal variables. A second question, however, is to what extent do all 5 judges agree on their beer rankings? If our judges don't agree at all which beers were best, then we can't possibly take their conclusions very seriously. Now, we could say that “our judges agreed to a large extent” but we'd like to be more precise and express the level of agreement in a single number. This number is known as Kendall’s Coefficient of Concordance W.2,3
Kendall’s W - Basic Idea
Let's consider the 2 hypothetical situations depicted below: perfect agreement and perfect disagreement among our raters. I invite you to stare at it and think for a minute.
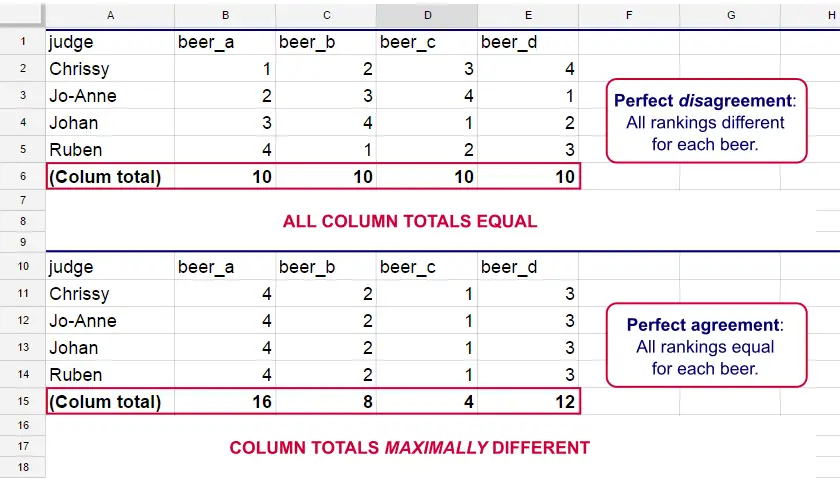
As we see, the extent to which raters agree is indicated by the extent to which the column totals differ. We can express the extent to which numbers differ as a number: the variance or standard deviation.
Kendall’s W is defined as
$$W = \frac{Variance\,over\,column\,totals}{Maximum\,possible\,variance\,over\,column\,totals}$$
As a result, Kendall’s W is always between 0 and 1. For instance, our perfect disagreement example has W = 0; because all column totals are equal, their variance is zero.
Our perfect agreement example has W = 1 because the variance among column totals is equal to the maximal possible variance. No matter how you rearrange the rankings, you can't possibly increase this variance any further. Don't believe me? Give it a go then.
So what about our actual beer data? We'll quickly find out with SPSS.
Kendall’s W in SPSS
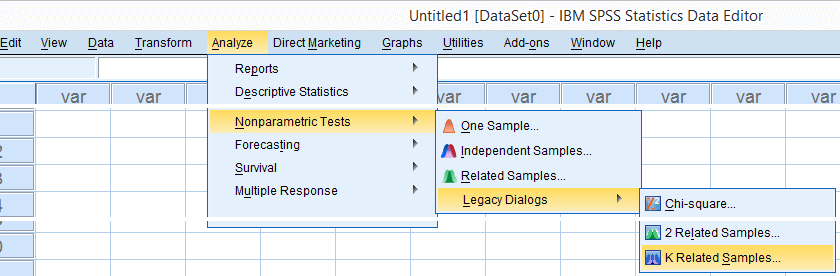
We'll get Kendall’s W from SPSS’ menu. The screenshots below walk you through.
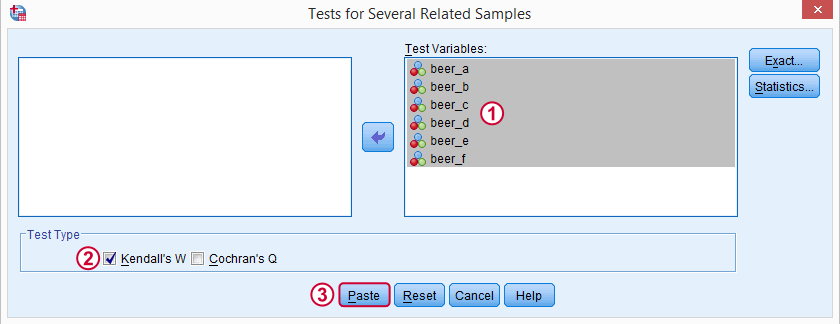
Note: SPSS thinks our rankings are nominal variables. This is because they contain few distinct values. Fortunately, this won't interfere with the current analysis. Completing these steps results in the syntax below.
Kendall’s W - Basic Syntax
NPAR TESTS
/KENDALL=beer_a beer_b beer_c beer_d beer_e beer_f
/MISSING LISTWISE.
Kendall’s W - Output
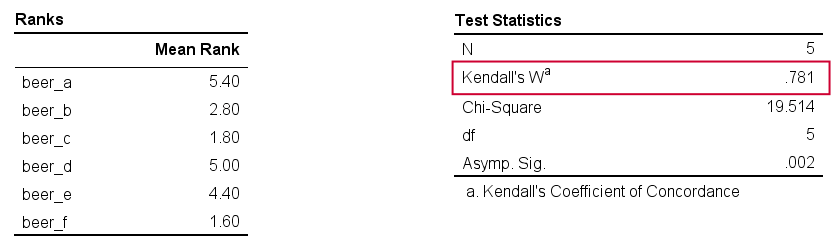
And there we have it: Kendall’s W = 0.78. Our beer judges agree with each other to a reasonable but not super high extent. Note that we also get a table with the (column) mean ranks that tells us which beer was rated most favorably.
Average Spearman Correlation over Judges
Another measure of concordance is the average over all possible Spearman correlations among all judges.1 It can be calculated from Kendall’s W with the following formula
$$\overline{R}_s = {kW - 1 \over k - 1}$$
where \(\overline{R}_s\) denotes the average Spearman correlation and \(k\) the number of judges.
For our example, this comes down to
$$\overline{R}_s = {5(0.781) - 1 \over 5 - 1} = 0.726$$
We'll verify this by running and averaging all possible Spearman correlations in SPSS. We'll leave that for a next tutorial, however, as doing so properly requires some highly unusual -but interesting- syntax.
Thank you for reading!
References
- Howell, D.C. (2002). Statistical Methods for Psychology (5th ed.). Pacific Grove CA: Duxbury.
- Slotboom, A. (1987). Statistiek in woorden [Statistics in words]. Groningen: Wolters-Noordhoff.
- Van den Brink, W.P. & Koele, P. (2002). Statistiek, deel 3 [Statistics, part 3]. Amsterdam: Boom.
THIS TUTORIAL HAS 27 COMMENTS:
By Fred on March 31st, 2022
Helpful
By Jon K Peck on September 6th, 2022
You say, rather elliptically, that the measurement level doesn't interfere with the test. To clarify, the measurement level setting does not affect this test at all as it just uses the ranks.
As for the significance level, if the Exact Test option is installed, a Monte Carlo or exact sig level can be calculated. This only matters, though, compared to the asymptotic (chi-squared) test for very small samples.
It should also be noted that the test and significance calculations do accommodate ties, but the calculation in the procedure is a bit more complicated than what is shown here.
By Tewedaj on September 9th, 2022
Why do we use none parametric tools?
thanks a lot,
By Ruben Geert van den Berg on September 9th, 2022
Hi Jon!
I think the "standard" computation for statistical significance is not ideal here: whether the population W is exactly zero is not an interesting question in the first place.
I think it would be better to use an alternative null hypothesis such as W = 0.70.
Or compute a confidence interval for W and see if its lower bound is lower than W = 0.70 or so.
But for very small samples, I think all results will be indicative at best...
By SO on March 23rd, 2023
Thank you for the wonderful explanation.
I googled more widely but almost no one explains how we should understand the SPSS output of Kendall's in full.
Could you please explain how to interpret the other values in the SPSS output, in accordance with the Kendall's W coefficient (.781)?
What do Chi-square (19.514), df (5) and Asymp.Sig (.002) tell us and how are they relevant to the Kendalls value in your example of the beer judges?