Summary
Merging some categories of a categorical variable in SPSS is not hard if you do it the right way. This tutorial demonstrates just that. We recommend you try the examples for yourself by downloading and opening hotel_evaluation.sav.
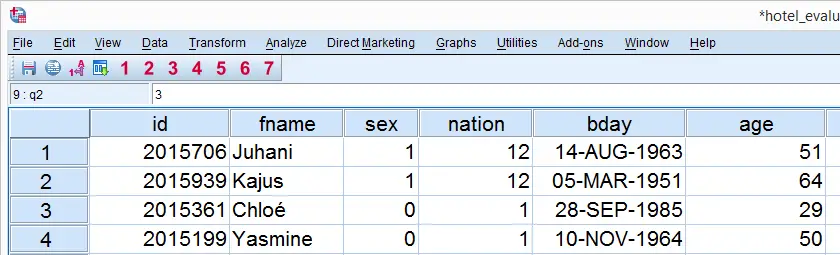
Right, when doing a routine inspection of this data file, we'll see that the variable nation has many small categories. This becomes apparent when running FREQUENCIES (syntax below, step 3). Before doing so, however, we'll first apply a variable label to this variable.
SPSS Syntax for Frequency Table
variable labels nation 'Respondents'' nationalities'.
*2. Show values and value labels in following output tables.
set tnumbers both tvars labels.
*3. Run basic frequency table.
frequencies nation.
Result
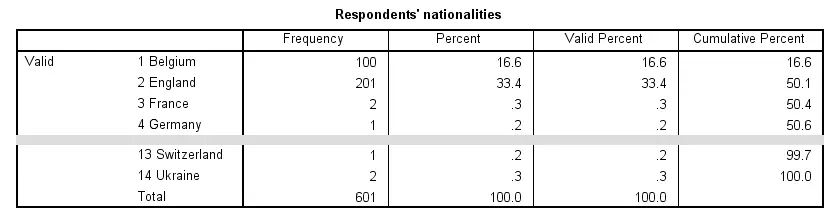
The frequency table tells us that we have 100 respondents from Belgium and 201 from England but only 2 from France and 1 from Germany. The latter are referred to as “small categories” and we often find these undesirable. Based on the entire frequency table, we choose to reorganize these nationalities as follows:
- Belgium;
- England;
- Spain;
- Sweden;
- All other countries.
Reorganizing nationalities like so requires merging all countries with small frequencies together into a new category. We'll now show two solid approaches for doing just that.
SPSS Merge Categories - Option 1
A very decent way to merge our small categories is creating a new variable with RECODE (syntax below, step 1). We'll call this new variable rec_nation which is short for “recoded nation”. Keep in mind that this new variable doesn't come with any variable labels or value labels. We'll therefore apply these ourselves. Finally, we'll inspect if the result is correct by running CROSSTABS.
recode nation (1 = 1)(2 = 2)(11 = 3)(12 = 4)(else = 5) into rec_nation.
*2. Apply value labels to new variable.
add value labels rec_nation 1 'Belgium' 2 'England' 3 'Spain' 4 'Sweden' 5 'Other'.
*3. Apply variable label to new variable.
variable labels rec_nation 'Respondents'' nationalities'.
*4. Show variable names and labels in succeeding output.
set tvars both.
*5. Inspect whether result is correct.
crosstabs nation by rec_nation.
Result
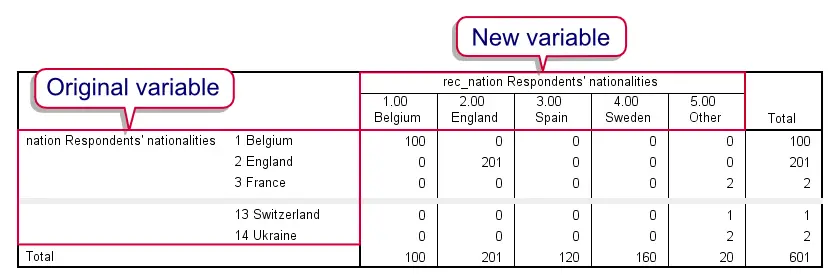
Note that every table row contains only zeroes except for one cell. Like so, we can quickly confirm that all 100 respondents from Belgium (first row) still have “Belgium” on our new variable. Since this pattern holds for all rows, we conclude that the result is indeed correct.
SPSS Merge Categories - Option 2
The first option we proposed uses only very basic syntax so it will work fine on all SPSS versions. A disadvantage, as we saw, is that it requires applying variable and value labels to the new variable. We'll therefore propose a faster approach that circumvents this. This will, however, require SPSS version 14 or higher with the SPSS Python Essentials properly installed.
Right, we first download and install the SPSS Clone Variables Tool. Note that this is an SPSS Extension Bundle. After doing so, we can use the syntax below for merging our categories as desired. Finally, we inspect the result in the same way as we did previously.
SPSSTUTORIALS CLONE VARIABLES VARIABLES ='nation' PREFIX ='ori_'.
*2. Recode original variable.
recode nation (1 = 1)(2 = 2)(11 = 11)(12 = 12)(else = 13).
*3. Change one value label.
add value labels nation 13 'Other'.
*4. Inspect whether result is correct.
crosstabs ori_nation by nation.
Result
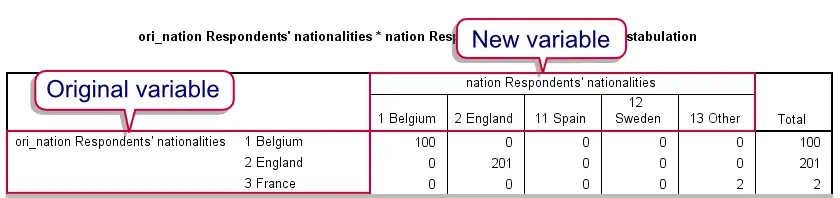
Note that the values of the adjusted variable are not contiguous. That is, we're using 1, 2, 11, 12 (...) instead of 1, 2, 3, 4. However, for reporting purposes we usually display only value labels and not the underlying values.
Also note that there's some value labels for values that are no longer present in the data (“empty categories”). However, since these don't show up in any way, this does not bother us either.
THIS TUTORIAL HAS 1 COMMENT:
By Ohisa William Ohide on April 28th, 2025
I Need my work to be done now