A standard deviation is a number that tells us
to what extent a set of numbers lie apart.
A standard deviation can range from 0 to infinity. A standard deviation of 0 means that a list of numbers are all equal -they don't lie apart to any extent at all.
Standard Deviation - Example
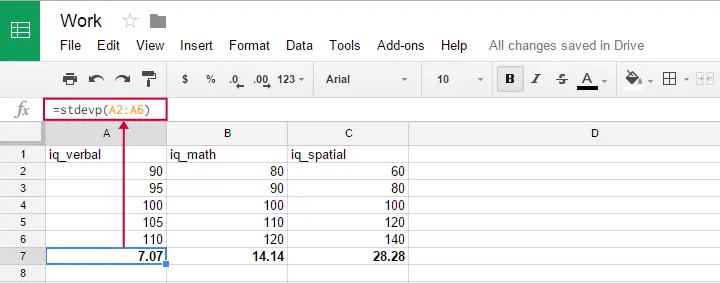
Five applicants took an IQ test as part of a job application. Their scores on three IQ components are shown below.
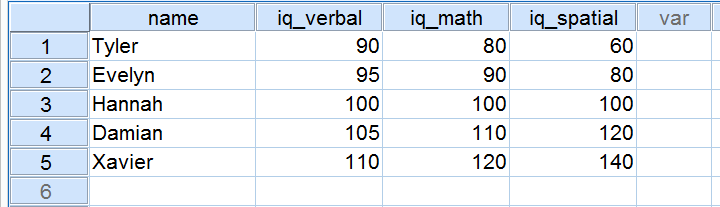
Now, let's take a close look at the scores on the 3 IQ components. Note that all three have a mean of 100 over our 5 applicants. However, the scores on iq_verbal lie closer together than the scores on iq_math. Furthermore, the scores on iq_spatial lie further apart than the scores on the first two components. The precise extent to which a number of scores lie apart can be expressed as a number. This number is known as the standard deviation.
Standard Deviation - Results
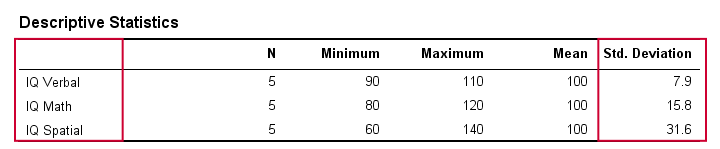
In real life, we obviously don't visually inspect raw scores in order to see how far they lie apart. Instead, we'll simply have some software calculate them for us (more on that later). The table below shows the standard deviations and some other statistics for our IQ data. Note that the standard deviations confirm the pattern we saw in the raw data.
Standard Deviation and Histogram
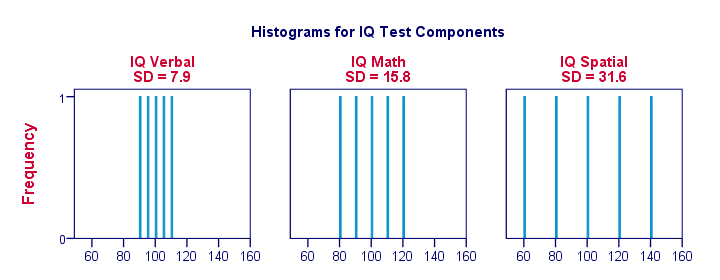
Right, let's make things a bit more visual. The figure below shows the standard deviations and the histograms for our IQ scores. Note that each bar represents the score of 1 applicant on 1 IQ component. Once again, we see that the standard deviations indicate the extent to which the scores lie apart.
Standard Deviation - More Histograms
When we visualize data on just a handful of observations as in the previous figure, we easily see a clear picture. For a more realistic example, we'll present histograms for 1,000 observations below. Importantly, these histograms have identical scales; for each histogram, one centimeter on the x-axis corresponds to some 40 ‘IQ component points’.
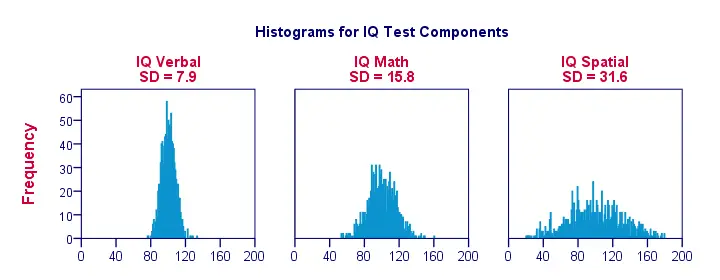
Note how the histograms allow for rough estimates of standard deviations. ‘Wider’ histograms indicate larger standard deviations; the scores (x-axis) lie further apart. Since all histograms have identical surface areas (corresponding to 1,000 observations), higher standard deviations are also associated with ‘lower’ histograms.
Standard Deviation - Population Formula
So how does your software calculate standard deviations? Well, the basic formula is
$$\sigma = \sqrt{\frac{\sum(X - \mu)^2}{N}}$$
where
- \(X\) denotes each separate number;
- \(\mu\) denotes the mean over all numbers and
- \(\sum\) denotes a sum.
In words, the standard deviation is the square root of the average squared difference between each individual number and the mean of these numbers.
Importantly, this formula assumes that your data contain the entire population of interest (hence “population formula”). If your data contain only a sample from your target population, see below.
Population Formula - Software
You can use this formula in Google sheets, OpenOffice and Excel by typing =STDEVP(...) into a cell. Specify the numbers over which you want the standard deviation between the parentheses and press Enter. The figure below illustrates the idea.
Oddly, the population standard deviation formula does not seem to exist in SPSS.
Standard Deviation - Sample Formula
Now for something challenging: if your data are (approximately) a simple random sample from some (much) larger population, then the previous formula will systematically underestimate the standard deviation in this population. An unbiased estimator for the population standard deviation is obtained by using
$$S_x = \sqrt{\frac{\sum(X - \overline{X})^2}{N -1}}$$
Regarding calculations, the big difference with the first formula is that we divide by \(n -1\) instead of \(n\). Dividing by a smaller number results in a (slightly) larger outcome. This precisely compensates for the aforementioned underestimation. For large sample sizes, however, the two formulas have virtually identical outcomes.
In GoogleSheets, Open Office and MS Excel, the STDEV function uses this second formula. It is also the (only) standard deviation formula implemented in SPSS.
Standard Deviation and Variance
A second number that expresses how far a set of numbers lie apart is the variance. The variance is the squared standard deviation. This implies that, similarly to the standard deviation, the variance has a population as well as a sample formula.
In principle, it's awkward that two different statistics basically express the same property of a set of numbers. Why don't we just discard the variance in favor of the standard deviation (or reversely)? The basic answer is that the standard deviation has more desirable properties in some situations and the variance in others.
THIS TUTORIAL HAS 32 COMMENTS:
By Ruben Geert van den Berg on September 11th, 2020
No, I totally agree with you. The expression is utter nonsense.
There is way way more to variables than just their means and SDs/SEMs: what about
-median
-mode
-skewness and
-kurtosis?
For a quick look at all such relevant statistics, inspect histograms. They'll show outliers too.
Hope that helps!
SPSS tutorials
By Hussein on July 28th, 2021
Its good