Levene’s test examines if 2+ populations all have
equal variances on some variable.
Levene’s Test - What Is It?
If we want to compare 2(+) groups on a quantitative variable, we usually want to know if they have equal mean scores. For finding out if that's the case, we often use
- an independent samples t-test for comparing 2 groups or
- a one-way ANOVA for comparing 3+ groups.
Both tests require the homogeneity (of variances) assumption: the population variances of the dependent variable must be equal within all groups. However, you don't always need this assumption:
- you don't need to meet the homogeneity assumption if the groups you're comparing have roughly equal sample sizes;
- you do need this assumption if your groups have sharply different sample sizes.
Now, we usually don't know our population variances but we do know our sample variances. And if these don't differ too much, then the population variances being equal seems credible.
But how do we know if our sample variances differ “too much”? Well, Levene’s test tells us precisely that.
Null Hypothesis
The null hypothesis for Levene’s test is that the groups we're comparing all have equal population variances. If this is true, we'll probably find slightly different variances in samples from these populations. However, very different sample variances suggest that the population variances weren't equal after all. In this case we'll reject the null hypothesis of equal population variances.
Levene’s Test - Assumptions
Levene’s test basically requires two assumptions:
- independent observations and
- the test variable is quantitative -that is, not nominal or ordinal.
Levene’s Test - Example
A fitness company wants to know if 2 supplements for stimulating body fat loss actually work. They test 2 supplements (a cortisol blocker and a thyroid booster) on 20 people each. An additional 40 people receive a placebo.
All 80 participants have body fat measurements at the start of the experiment (week 11) and weeks 14, 17 and 20. This results in fatloss-unequal.sav, part of which is shown below.
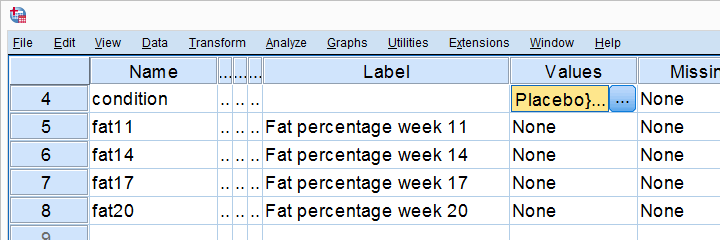
One approach to these data is comparing body fat percentages over the 3 groups (placebo, thyroid, cortisol) for each week separately.Perhaps a better approach to these data is using a single mixed ANOVA. Weeks would be the within-subjects factor and supplement would be the between-subjects factor. For now, we'll leave it as an exercise to the reader to carry this out. This can be done with an ANOVA for each of the 4 body fat measurements. However, since we've unequal sample sizes, we first need to make sure that our supplement groups have equal variances.
Running Levene’s test in SPSS
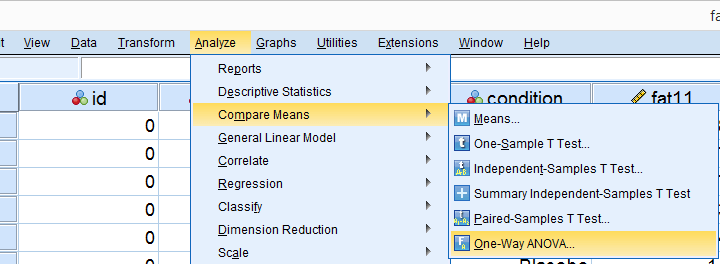
Several SPSS commands contain an option for running Levene’s test. The easiest way to go -especially for multiple variables- is the One-Way ANOVA dialog.This dialog was greatly improved in SPSS version 27 and now includes measures of effect size such as (partial) eta squared. So let's navigate to
![]()
![]() and fill out the dialog that pops up.
and fill out the dialog that pops up.
As shown below,  the Homogeneity of variance test under Options refers to Levene’s test.
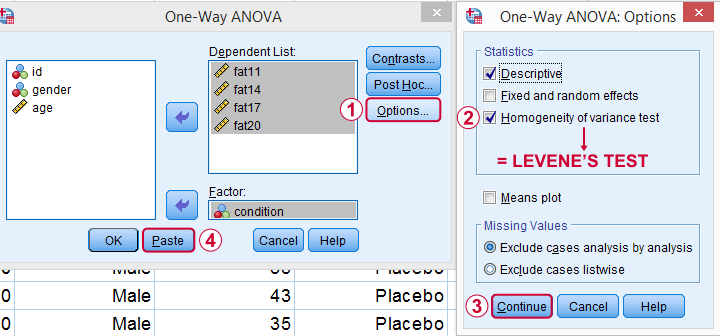
Clicking results in the syntax below. Let's run it.
SPSS Levene’s Test Syntax Example
ONEWAY fat11 fat14 fat17 fat20 BY condition
/STATISTICS DESCRIPTIVES HOMOGENEITY
/MISSING ANALYSIS.
Output for Levene’s test
On running our syntax, we get several tables. The second -shown below- is the Test of Homogeneity of Variances. This holds the results of Levene’s test.
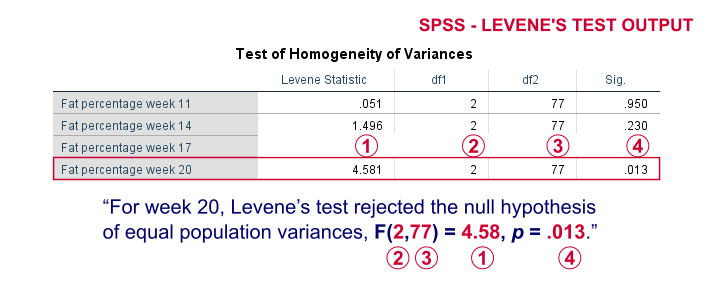
As a rule of thumb, we conclude that population variances are not equal if “Sig.” or p < .05. For the first 2 variables, p > .05: for fat percentage in weeks 11 and 14 we don't reject the null hypothesis of equal population variances.
For the last 2 variables, p < .05: for fat percentages in weeks 17 and 20, we reject the null hypothesis of equal population variances. So these 2 variables violate the homogeneity of variance assumption needed for an ANOVA.
Descriptive Statistics Output
Remember that we don't need equal population variances if we have roughly equal sample sizes. A sound way for evaluating if this holds is inspecting the Descriptives table in our output.
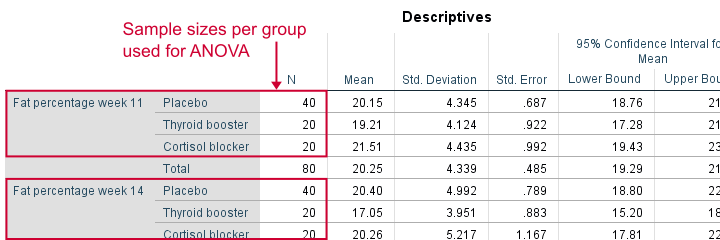
As we see, our ANOVA is based on sample sizes of 40, 20 and 20 for all 4 dependent variables. Because they're not (roughly) equal, we do need the homogeneity of variance assumption but it's not met by 2 variables.
In this case, we'll report alternative measures (Welch and Games-Howell) that don't require the homogeneity assumption. How to run and interpret these is covered in SPSS ANOVA - Levene’s Test “Significant”.
Reporting Levene’s test
Perhaps surprisingly, Levene’s test is technically an ANOVA as we'll explain here. We therefore report it like just a basic ANOVA too. So we'll write something like “Levene’s test showed that the variances for body fat percentage in week 20 were not equal, F(2,77) = 4.58, p = .013.”
Levene’s Test - How Does It Work?
Levene’s test works very simply: a larger variance means that -on average- the data values are “further away” from their mean. The figure below illustrates this: watch the histograms become “wider” as the variances increase.
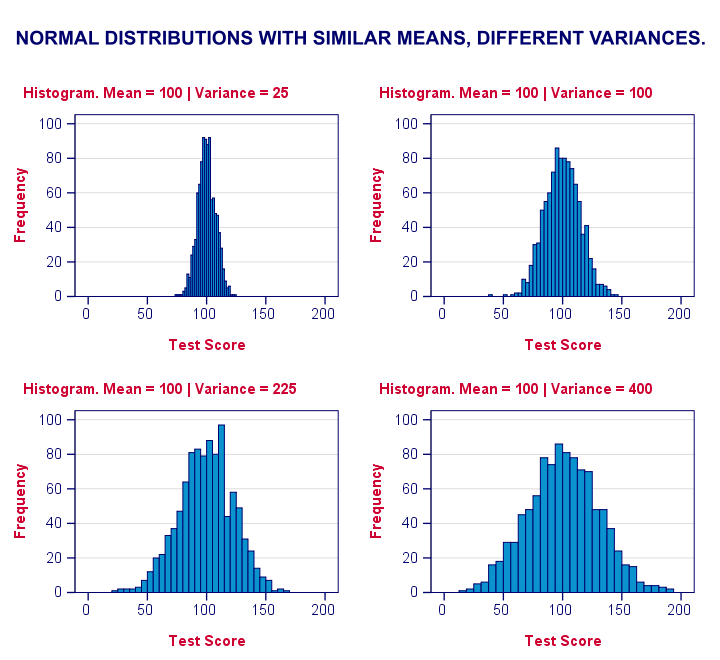
We therefore compute the absolute differences between all scores and their (group) means. The means of these absolute differences should be roughly equal over groups. So technically, Levene’s test is an ANOVA on the absolute difference scores. In other words: we run an ANOVA (on absolute differences) to find out if we can run an ANOVA (on our actual data).
If that confuses you, try running the syntax below. It does exactly what I just explained.
“Manual” Levene’s Test Syntax
aggregate outfile * mode addvariables
/break condition
/mfat20 = mean(fat20).
*Compute absolute differences between fat20 and group means.
compute adfat20 = abs(fat20 - mfat20).
*Run minimal ANOVA on absolute differences. F-test identical to previous Levene's test.
ONEWAY adfat20 BY condition.
Result
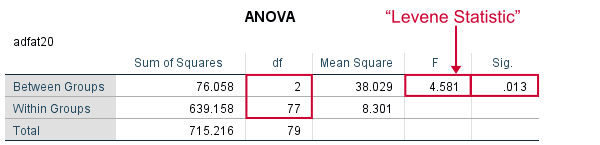
As we see, these ANOVA results are identical to Levene’s test in the previous output. I hope this clarifies why we report it as an ANOVA as well.
Thanks for reading!
THIS TUTORIAL HAS 39 COMMENTS:
By Ayo on September 17th, 2021
How related is Levene's test to Chi square test for same data.
By Ruben Geert van den Berg on September 18th, 2021
Hi Ayo!
The "chi-square test" usually refers to the chi-square independence test and that's completely unrelated to Levene's test.
However, there's also a chi-square test for a single variance but it's hardly ever used and not present in SPSS. You could see this as a univariate version for the (between-subjects) Levene's test.
For a nice overview, make sure to take a look at Which Statistical Test Should I Use?
Hope that helps!
SPSS tutorials
By Dylan on December 3rd, 2021
Hi, Ruben,
Thank you for the tutorial !
is there any reference I can use to support
"Remember that we don't need equal population variances if we have roughly equal sample sizes"
Because I thought this equal variance is a prerequisite to run ANOVA in the first place!
Thank you very much !
Dylan
By Ruben Geert van den Berg on December 4th, 2021
Hi Dylan!
No, unequal sample sizes are fine for ANOVA.
However, a consequence is that your data need to meet the homogeneity assumption.
Most standard textbooks mention this but I don't have access to them right now because I'm on holiday.
Anyway, try
Field, A. (2013). Discovering Statistics with IBM SPSS Statistics. Newbury Park, CA: Sage.
For more on this point, read up on
SPSS ANOVA - Levene’s Test “Significant” and
SPSS - One Way ANOVA with Post Hoc Tests Example
Hope that helps!
SPSS tutorials
By Bilyana on December 11th, 2021
An incredibly helpful site! Thank you :)