The most basic table in statistics is probably a simple frequency distribution. Sadly, basic frequency tables from SPSS are monstrous. On top of that, they don't meet APA recommendations.
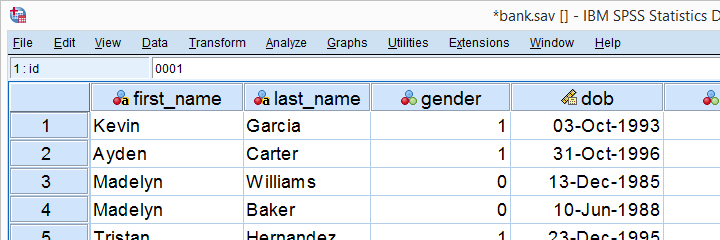
So how to create better frequency tables -preferably fast? This tutorial shows a cool trick for doing just that! We'll use bank_clean.sav throughout, part of which is shown below.
Why Basic SPSS Frequency Tables Suck
So let's take a close look at some basic frequency tables. We'll create some by running the syntax below.
set
tnumbers labels
tvars labels.
*Standard SPSS frequencies tables.
frequencies educ marit.
Result
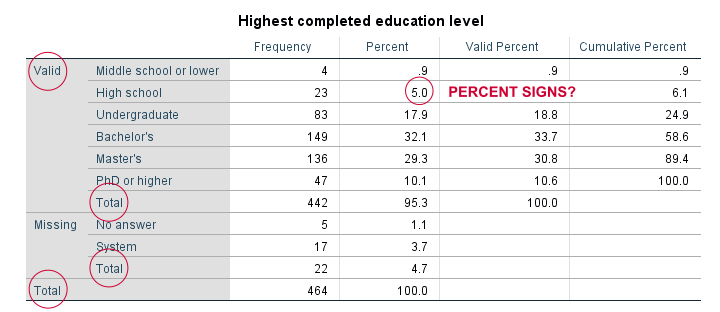
For just inspecting your data, this may do. However, these tables are not suitable for reporting:
- SPSS users surely know the difference between valid and missing values. However, clients who don't use SPSS often find this confusing.
- “Total” appears no less than 3 times in our tables.
- Percent signs are missing from percentages.
- We rarely need cumulative frequencies -which are really cumulative valid frequencies.
- The new styling for output tables -introduced in SPSS 23- looks disastrous.
Now, the styling is easily fixed with a tablelook. After applying it, our table looks much better as shown below.
Unfortunately, FREQUENCIES has no options for avoiding the other issues we just mentioned. So let's try something completely different.
Frequencies in MEANS Tables
Ok, this'll sound crazy but -really- do give it a go. First off, we'll create a new variable holding zeroes for all cases. Next, we'll run a minimal MEANS table for our constant by our target variables. Let's run the syntax below and see what happens.
compute constant = 0.
*Basic means tables constant over educ and marit.
means constant by educ marit.
Result

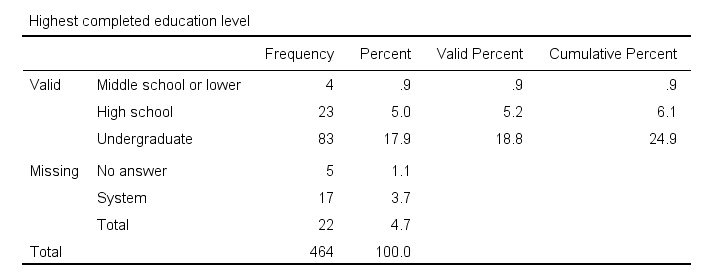
Our table looks stupid. Obviously, all means and standard deviations are 0.000. However, we do have clean and simple frequencies but we don't have the corresponding percentages. Yet.
MEANS without Means
Now the trick is that MEANS allows us to choose which columns we want in which order. Therefore, we can have MEANS without means or standard deviations but with frequencies and percentages. This results in nice and clean frequency tables in the APA recommended format.
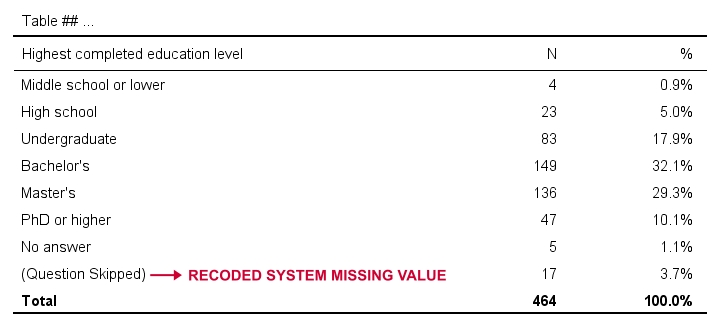
variable labels constant 'Table ## ...'.
*Run means table but show only frequencies and percentages.
means constant by educ marit
/cells count npct.
*Optionally: prettify tables.
output modify
/select tables
/table tabletitle = ' '
/tablecells select = ['% of Total N'] applyto = columnheader replace = '%'
/tablecells select = ['Total'] applyto = row style = bold.
Result
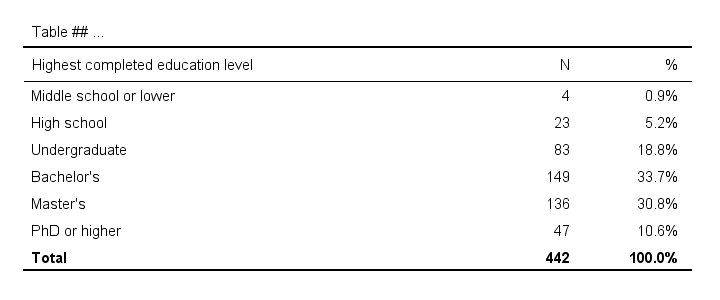
First note that we set part of the desired table title as a variable label for our constant. If you don't want that, try and run
variable labels constant ' '.
After doing so, the title consists of a single space so there seems to be no title at all.
Also note that we prettified our tables with OUTPUT MODIFY which requires SPSS version 22 or higher. For keeping it simple, we processed all tables in the output window. If you don't want that, adding one or two lines to OUTPUT MODIFY restricts the modifications to a precise selection of tables.
If you're on SPSS 21 or lower, the Ctrl + H shortkey -either in the output window or after exporting to WORD- may help in removing or replacing text.
Including User Missing Values
By default, our approach includes only valid values. However, including user missing values is easily done by just adding a single line to the syntax.
means constant by educ marit
/cells count npct
/missing include.
Including System Missing Values
Very few SPSS procedures can include system missing values. However, that's easily solved: we'll use a simple RECODE to change them to some huge number. We then give that a value label and set it as missing.
Quick tip: don't use very small numbers such as -9999 for this. Small numbers often end up as the first -rather than the last- rows in your tables.
recode educ marit (sysmis = 999999999).
*Add value label.
add value labels educ marit 999999999 '(Question Skipped)'.
*Set 999999999 as user missing.
missing values educ marit (999999999,7).
*Run APA frequencies with user and system missing values.
means constant by educ marit
/cells count npct
/missing include.
Result
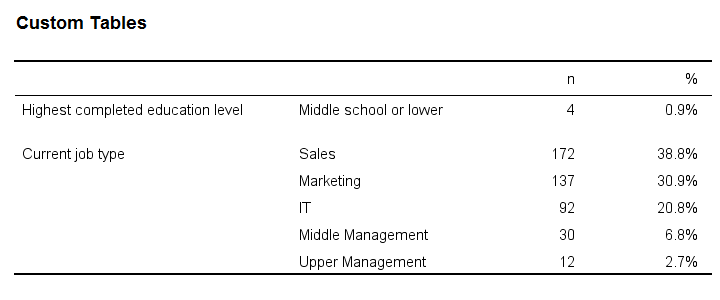
APA Frequency Tables from CTABLES
For me, creating frequency tables like we just discussed is the preferred option. It's fast and simple. However, an alternative is using CTABLES but this requires a license for the custom tables option.
CTABLES can create a single frequency table for multiple variables in one go. The syntax below presents a minimal example for doing so.
ctables
/table (educ + jtype) [count 'n' colpct.count '%'].
Result
So that'll do for our frequency tables. I hope you found this tutorial helpful! Let me know by throwing in a comment below.
Thanks for reading!
THIS TUTORIAL HAS 9 COMMENTS:
By Johnny Rutz on October 30th, 2018
How can I get more tutorials like this? Also is there any videos that I can take a look?
Thanks in advance
By Ruben Geert van den Berg on October 30th, 2018
Hi Johnny!
Our website is full of tutorials like these. Especially, take a look at our SPSS beginners tutorials and our SPSS data analysis tutorials.
We may start publishing videos in 2019. We first want to have the best possible tutorials before investing in video versions of them.
By WILLIAM C PECK on November 17th, 2018
Looks really good! I hope to include in my current survey :-) Google search was like 5 or 6 down, but there it was, and right on the money ...
By Ruben Geert van den Berg on November 17th, 2018
Thanks! This is a very recent tutorial and I think -or at least hope!- we're getting better at writing them.
By Jesus on February 4th, 2019
Great!
Thank you.