Introduction & Practice Data File
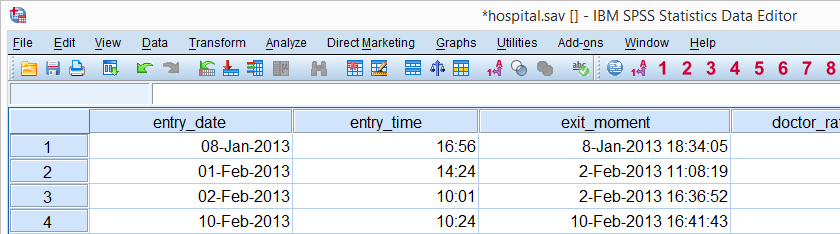
SPSS date calculations are pretty straightforward. Just make sure you understand a handful of basics and keep it clean and simple. This tutorial shows you how to do just that. We'll use hospital.sav -shown below- throughout.
SPSS Main Date Functions
The table below shows SPSS’ main date functions. We'll show how to use them on a couple of examples below.
| Function | Use | Example | Returns |
|---|---|---|---|
| DATEDIFF | Compute difference between two dates in given time unit | datediff(date1,date2,'days') | Standard numeric value |
| DATESUM | Add / subtract number of given time units to date variable | datesum(date,10,'days') | Date value |
| XDATE | Extract date component from date variable | xdate.month(date) | Standard numeric value |
| DATE.DMY | Create date value from day, month, year | date.dmy(19,3,2015) | Date value |
SPSS DATEDIFF Function
SPSS DATEDIFF returns the number of time units
(such as hours, days or years) between two date values.
For instance, how many days ago did our respondents enter the hospital? We'll answer that by subtracting entry_date from the current date. The syntax below does just that.
compute today = $time.
execute.
*2. Show current date in date format.
formats today(edate10).
*3. Compute
compute days_ago = datediff(today,entry_date,'days').
execute.
*4. Don't show any decimal places.
formats days_ago(f4).
Result
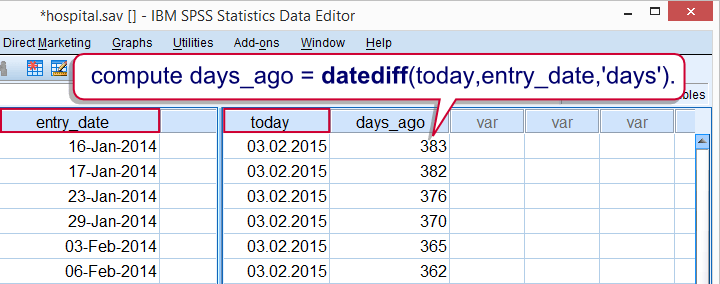
Simple as that. Just one thing to keep in mind is that DATEDIFF truncates (rounds down) its outcome values. So 2 years and 363 days are returned as 2 years and 0 days if years are chosen as the time unit.
If you don't want that, extract the number of days between 2 dates and divide them by 365.25 like we did in How to Compute Age in SPSS?
SPSS DATESUM Function
SPSS DATESUM adds a number of time units to a date variable.
For subtracting time, just enter a negative value.
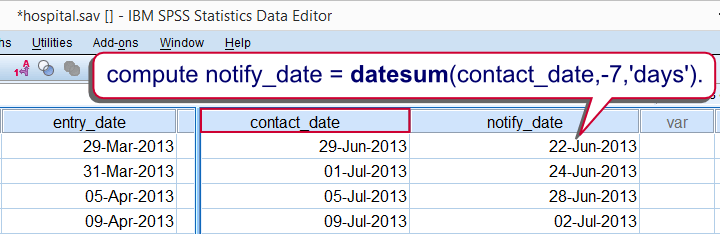
So say I want to contact respondents 3 months after they entered the hospital. However, 7 days before contacting them, they should be sent a notification. The syntax below shows how to add both dates to our data.
compute contact_date = datesum(entry_date,3,'months').
execute.
*2. Show time values as dates.
formats contact_date(date11).
*3. Subtract 7 days from contact_date as notify_date.
compute notify_date = datesum(contact_date,-7,'days').
execute.
*4. Show time values as dates.
formats notify_date(date11).
Result
SPSS XDATE Function
SPSS XDATE extracts a date component
(such as an hour, day or year) from a date.
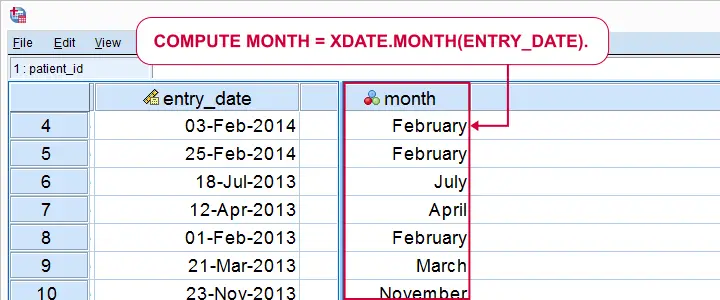
For example, the syntax below first extracts the year from entry_date and then the month.
compute year = xdate.year(entry_date).
execute.
*2. Extract month from date.
compute month = xdate.month(entry_date).
execute.
*3. Hide decimals.
formats year month(f4).
*4. Apply value labels to month.
value labels month 1 'January' 2 'February' 3 'March' 4 'April' 5 'May' 6 'June' 7 'July' 8 'August' 9 'September' 10 'October' 11 'November' 12 'December'.
Result
Again, it's as simple as that. An important warning, however, is that XDATE.WEEK returns nonsensical week numbers as discussed in SPSS Computes Wrong Week Numbers? Unfortunately, there's no easy way to extract the ISO week numbers that you probably want. We built an SPSS-Python tool for it but it somehow stopped working around SPSS version 24.
Another thing to keep in mind is that there's no such thing as XDATE.DAY. Instead, use
- XDATE.MDAY for the day of the month (1 through 31);
- XDATE.WKDAY for the day of the week (1 through 7 where 1 is Sunday, not Monday);
- XDATE.JDAY for the day of the year (1 through 366).
SPSS DATE.DMY Function
SPSS DATE.DMY creates a date from its components
such as day, month and year.
So say I want to know how many days before 20 January 2015 patients entered the hospital. I'll just create a new date variable (or -rather- constant) holding this date and subtract it from entry_date.
compute start_date = date.dmy(20,1,2015).
execute.
*2. Show start_date as date.
formats start_date (date11).
*3. Compute days before start of data analysis.
compute days_passed = datediff(start_date,entry_date,'days').
execute.
Result
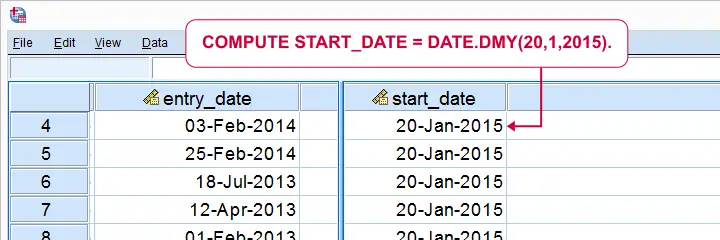
Obviously, DMY means “day, month, year” so that's the order in which we'll enter these date components. Now, in first instance, DATE.DMY results in a variable holding huge numbers. These are the numbers of seconds between the year 1582 and my actual data as explained in SPSS Date Variables Basics.
These huge numbers can be shown as normal dates by setting the appropriate formats. For instance,
FORMATS today (DATE11).
shows a date as “3-Sep-2018”. This is what we recommend because it's unambiguous which date this is. Please
avoid showing dates like “01-02-03”
because this could mean
- 1-Feb-2003 if its format is EDATE8 (European date),
- 2-Jan-2003 if its format is ADATE8 (American date) and
- 3-Feb-2001 if its format is SDATE8 (sortable date).
SPSS Date Comparisons
When we compare two numbers, we can simply ask if one number is larger than the other. The exact same, simple logic holds for date comparisons. However, there's one caveat: although we see “normal dates”, the underlying values (numbers of seconds since the year 1582) are used in date comparisons.
This may sound daunting but the solution is simple: if we want to compare an SPSS date value with some comparison date, we simply
convert the comparison date into an actual SPSS date.
We just saw how to do so easily: fill in the date components into DATE.DMY. We'll demonstrate this with some examples.
Say the hospital got a new CEO on February 20, 2014. We want to know if visits before this date are rated the same as visits after this date. We'll now select visits on and after February 20, 2014.
SPSS Date Comparison Example I
compute ceo = 0.
*2. If entry date is at least February 20th., 2014, entry during new CEO.
if (entry_date >= date.dmy(20,2,2014)) ceo = 1.
execute.
*3. Hide unnecessary decimals.
formats ceo(f1).
*4. Add value labels to new variable.
value labels ceo 0 'entry_date during old CEO' 1 'entry_date during new CEO'.
Result
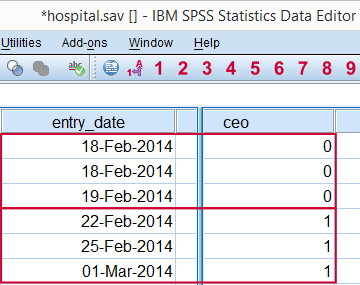 Flagging visits that started on or after February 20, 2014.
SPSS Date Comparison Syntax Example II
The Summer holidays in 2014 were from June 30, 2014 through August 24, 2014. How can we select visits during these holidays? The syntax below shows how to do so easily by using DATE.DMY within RANGE.
compute holidays_2014 = 0.
*2. Change 0 to 1 if visit started during holidays 2014.
if (range(entry_date,date.dmy(30,6,2014),date.dmy(24,8,2014))) holidays_2014 = 1.
execute.
*3. Hide decimals.
formats holidays_2014(f1).
That's basically it for the main DATE calculations in SPSS. We could come up with a million more examples but you'll probably figure them out yourself pretty easily. We hope.
Thanks for reading!
THIS TUTORIAL HAS 11 COMMENTS:
By kajally on May 29th, 2025
creating a code book