- Summary
- Wrong Covariances from FACTOR
- Correct Covariances from CORRELATIONS
- Correct Covariances from REGRESSION
Summary
When using pairwise exclusion of missing values, SPSS FACTOR computes wrong covariances. For correct covariances, use
- CORRELATIONS (menu or syntax) or
- REGRESSION (syntax only).
This tutorial presents a quick comparison of these 3 methods. We'll use baby-weights.sav -partly shown below- for all examples.
Wrong Covariances from FACTOR
Right. So let's compute the covariance matrix for weight000 through weight036 by using FACTOR. The SPSS syntax below does so using pairwise exclusion of missing values.
factor
/variables weight000 to weight036
/missing pairwise
/print correlation covariance.
Result
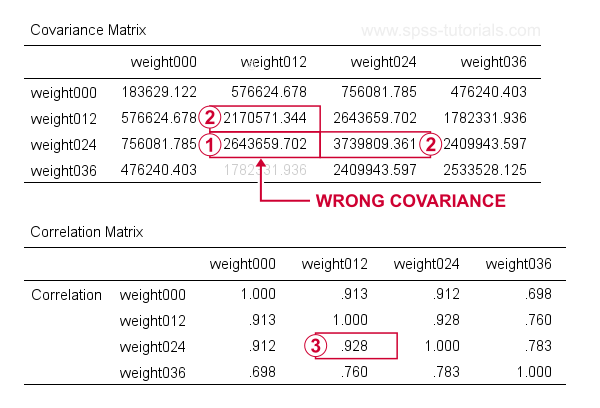
At first, these results look perfect. Now, let's recompute  the covariance between weight012 and weigh024 from
  the variances and
  the correlation for these variables by using
$$S_{xy} = r_{xy} \cdot s_x \cdot s_y$$
where
- \(S_{xy}\) denotes the (sample) covariance between variables \(X\) and \(Y\);
- \(r_{xy}\) denotes the (Pearson) correlation between \(X\) and \(Y\);
- \(s_x\) and \(s_y\) denote the (sample) standard deviations of \(X\) and \(Y\).
This gives
$$S_{xy} = 0.928 \cdot \sqrt{2170571} \cdot \sqrt{3739809} = 2643660$$
which is indeed what SPSS reports here. So how could this possibly be wrong? Our second approach will clarify just that and come up with different -but correct- results.
Correct Covariances from CORRELATIONS
The only way to obtain covariances from SPSS’ menu is by navigating to
![]()
![]() as shown below.
as shown below.
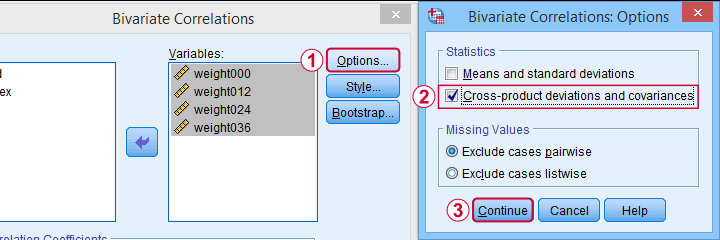
This results in the syntax below. Let's run it.
CORRELATIONS
/VARIABLES=weight000 weight012 weight024 weight036
/PRINT=TWOTAIL NOSIG FULL
/STATISTICS XPROD
/MISSING=PAIRWISE.
Result
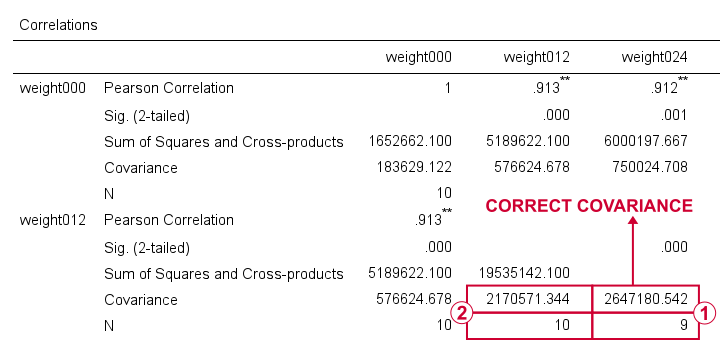
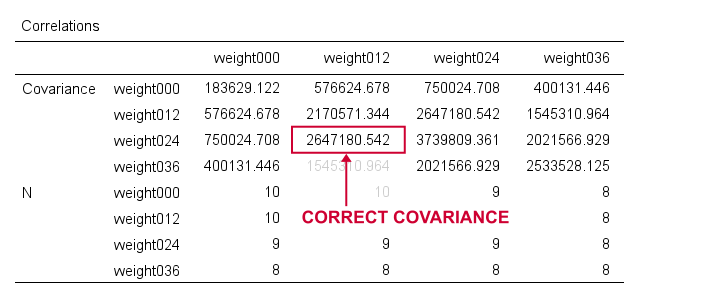
For weight012 and weight024, SPSS reports \(S_{xy}\) = 2647181. Note that this is based on a subsample of N = 9 cases due to pairwise exclusion of missing values.
The variance for weight012, however, is based on a different subsample of N = 10...
...and that's why the previous results were wrong. FACTOR seems to compute each covariance from a correlation and two variances that may all be based on different subsamples!
CORRELATIONS, however, correctly computes all components for a covariance on the same subsample: all cases having valid values on both variables. Alternative software such as Excel and Googlesheets also comply with this approach.
I think these results provide sufficient evidence for my claim that FACTOR may compute wrong covariances. Nevertheless, let's see what our third -and best- method for obtaining covariances comes up with...
Correct Covariances from REGRESSION
The syntax below illustrates how to obtain covariances and the sample sizes they're based on via REGRESSION.
regression
/missing pairwise
/dependent weight000
/method enter weight012 to weight036
/descriptives n cov.
Result
Although the multiple regression results aren't helpful, the previous syntax does result in a nice and clean covariance matrix as shown below.
First off, note that REGRESSION comes up with the same (correct) covariances as CORRELATIONS. So that makes 1 against 2 -or more if we take Excel and/or Googlesheets into account.
Second, note that REGRESSION results in a convenient table layout that's sorted by statistic rather than by variable. This usually comes in handy for further processing such as
- computing Cronbach’s alpha or
- some kind of factor analysis.
So that's basically it. Let me know what you think by throwing in a comment below. We always appreciate some feedback. Also if you think our tutorials totally suck.
Thanks for reading!
THIS TUTORIAL HAS 8 COMMENTS:
By Rick M on September 29th, 2021
Hi! Nice article! However, I'm not certain you're correct. I haven't checked yet, but it's possible that SPSS is using two different ways - each acceptable! - to compute the covariances: One using the "available case" mean for each var, the other only the pairwise-valid mean.
By Ruben Geert van den Berg on September 30th, 2021
Hi Rick, thanks for your comment!
However, I think it basically boils down to a definition of what's "wrong" or "acceptable".
IMHO, the FACTOR formula is very awkward at best.
Another point is that scientifically, each concept should have a (single) strict definition. Ideally, no concepts have more than 1 definition (or "acceptable" formula) because this creates room for subjectivity.
So scientist A could report great results based on the FACTOR formula while scientist B finds crappy results based on the regression formula.
This possibility is highly undesirable in the broader frame of science.
The same basic point could be made for 1-tailed significance which -I think- is unacceptable whenever 2-tailed p-values are available as well.
By Jon K Peck on September 30th, 2021
SPSS QA reports this.
FACTOR covariances are computed from r(x,y)*sd(x)*sd(y) where the means and SDs use all available cases for X and Y independently. On the other hand, the covariances computed by CORR and REGRESSION and MVA use pairwise-valid data only for these same statistics.
Using all available cases for means and sds is perfectly acceptable (BMDP had a missing data method explicitly called ALLVALUE which did what FACTOR is doing) as a variant of PAIRWISE; Little & Rubin referred to it in their book on missing data.
Still, this method is inconsistent with pairwise as used in CORR, REGRESSION, and MVA. We want FACTOR to conform to them, so it will be changed.
By Rick M on September 30th, 2021
I have demonstrated to myself by hand that in FACTOR, SPSS is indeed using r(x,y)*sd(x)*sd(y) for cov(x,y). This is NOT wrong but IS inconsistent with CORR, REGRESSION, and MVA. Little and Rubin, in their book on missing data (1987), refer to the method used in FACTOR as "All Available Values," where for the sufficient statistics - Sums and Sums of Squares - one uses all available cases for each variable without respect to missing values on any other variable. This is a perfectly valid variant of PAIRWISE. When data are MCAR (missing completely at random - see Little and Rubin 1987 again), this yields estimates that are arguably more reliable, since they use more of the data.
However, you are quite right that it is inconsistent.
By Rick M on September 30th, 2021
Somehow, I got cut off before I finished. :)
I said that you are quite right that it is inconsistent and it is good to point it out, but I am equally right that it is NOT wrong (mathematically).
As for different results based on the two slightly different covariance methods, I am not at all doubting you BUT if that happens, then the real problem is quite possibly that the data are NOT missing completely at random. In that case, NEITHER missing-data method is valid and their results should not be used.
As a matter of good science (which I too advocate!), it would be best *before anything else* to run those data through MVA - the MISSING VALUES procedure in SPSS - checking Little's test for MCAR. If the data fail, then compute the variances and covariances using their EM algorithm, then use the EM covariance/correlation matrix as input to FACTOR, CORR, REGRESSION, etc.
Again, nice article Ruben! Thanks!