Also see SPSS Moderation Regression Tutorial.
For testing moderation effects in multiple regression, we start off with mean centering our predictors:
mean centering a variable is subtracting its mean
from each individual score.
After doing so, a variable will have a mean of exactly zero but is not affected otherwise: its standard deviation, skewness, distributional shape and everything else all stays the same.
After mean centering our predictors, we just multiply them for adding interaction predictors to our data. Mean centering before doing this has 2 benefits:
- it tends to diminish multicollinearity, especially between the interaction effect and its constituent main effects;
- it may render our b-coefficients more easily interpretable.
We'll cover an entire regression analysis with a moderation interaction in a subsequent tutorial. For now, we'll focus on
how to mean center predictors
and compute (moderation) interaction predictors?
Mean Centering Example I - One Variable
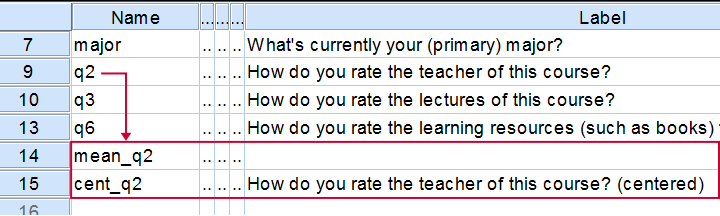
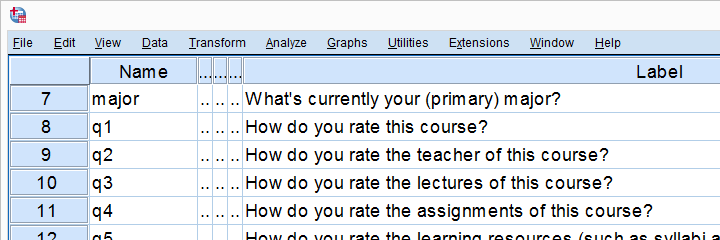
We'll now mean center some variables in course_evaluation.sav. Part of its variable view is shown below.
Let's start off with q2 (“How do you rate the teacher of this course?”). We'll first add this variable's mean as a new variable to our dataset with AGGREGATE.
The syntax below does just that. Don't bother about any menu here as it'll only slow you down.
Syntax for Adding a Variable's Mean to our Data
aggregate outfile * mode addvariables
/mean_q2 = mean(q2).
Result
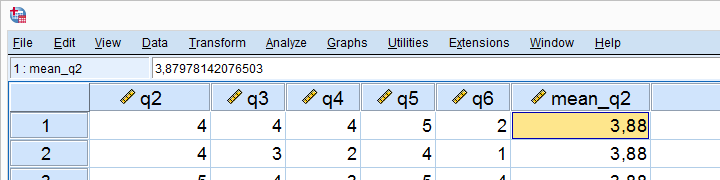
The mean for q2 seems to be 3.88.Sorry for the comma as a decimal separator here. I had my LOCALE set to Dutch when running this example. But oftentimes in SPSS,
what you see is not what you get.
If we select a cell, we see that the exact mean is 3.87978142076503. This is one reason why we don't just subtract 3.88 from our original variable -as proposed by many lesser tutorials.
A second reason is that our approach will still work perfectly if we decide to precede it with FILTER, SELECT IF or WEIGHT.
Right, now the second -and final- step is simply subtracting this mean from our original variable with COMPUTE. We'll then run a quick check on the result and we're done.
Subtracting the Mean from the Original Values
compute cent_q2 = q2 - mean_q2.
*Add variable label to centered variable.
variable labels cent_q2 "How do you rate the teacher of this course? (centered)".
*Check results.
descriptives q2 cent_q2.
*Delete helper variable.
delete variables mean_q2.
Result
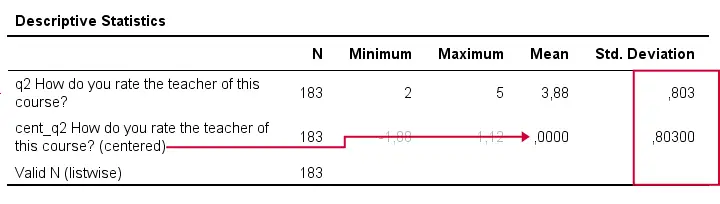
A quick check after mean centering is comparing some descriptive statistics for the original and centered variables:
- the centered variable must have an exactly zero mean;
- the centered and original variables must have the exact same standard deviations.
If these 2 checks hold, we can be pretty confident our mean centering was done properly.
Mean Centering Example II - Several Variables
In a real-life analysis, you'll probably center at least 2 variables because that's the minimum for creating a moderation predictor. You could mean center several variables by repeating the previous steps for each one.
However, it can be done much faster if we speed things up by
- throwing several variables into a single AGGREGATE command,
- using DO REPEAT for subtracting each variable's mean from the original scores and
- not creating helper variables holding means.
The syntax below does just that.
Syntax Example - Mean Center Several Variables
aggregate outfile * mode addvariables
/cent_q3 to cent_q6 = mean(q3 to q6).
*Subtract means from original variables.
do repeat #ori = q3 to q6 / #cent = cent_q3 to cent_q6.
compute #cent = #ori - #cent.
end repeat.
*Add variable labels to centered variables.
variable labels cent_q3 "How do you rate the lectures of this course? (centered)".
variable labels cent_q4 "How do you rate the assignments of this course? (centered)".
variable labels cent_q5 "How do you rate the learning resources (such as syllabi and handouts) that were issued by us? (centered)".
variable labels cent_q6 "How do you rate the learning resources (such as books) that were not issued by us? (centered)".
*Check results.
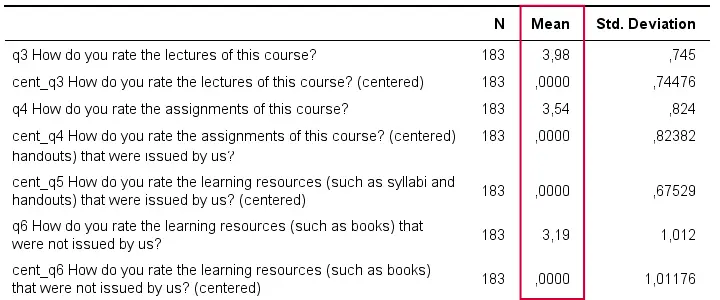
descriptives q3 cent_q3 q4 cent_q4 q5 cent_q5 q6 cent_q6.
Result
Adding Moderation Predictors to our Data
Although beyond the scope of this tutorial, creating moderation predictors is as simple as multiplying 2 mean centered predictors.
compute int_1 = cent_q3 * cent_q4.
*Apply short but clear variable label to interaction predictor.
variable labels int_1 "Interaction: lecture rating * assignment rating (both centered)".
For testing if q3 moderates the effect of q4 on some outcome variable, we simply enter this interaction predictor and its 2 mean centered(!) constituents, cent_q3, cent_q4 into our regression equation.
We'll soon cover the entire analysis (on more suitable data) in a subsequent tutorial.
Thanks for reading!
THIS TUTORIAL HAS 12 COMMENTS:
By Jon K Peck on July 25th, 2018
First, you might as well just use the standardizing available in DESCRIPTIVES as the effective results will be the same (scaled by std deviation).
More importantly, though, mean centering does not really affect multicollinearity. Without the interaction terms, in fact, the results with and without mean centering are identical. And if you calculate effects taking everything into account, you get the same results either way.
Mean centering may affect ease of interpretation of results, but it does not affect conclusions.
This link discusses the issue at length
https://link.springer.com/article/10.3758/s13428-015-0624-x
By Ruben Geert van den Berg on July 26th, 2018
Hi Jon, thanks for your feedback!
"Without the interaction terms, in fact, the results with and without mean centering are identical."
Sure. But the whole point but is that we sometimes do want to include an interaction term. In fact, I find it kinda odd that they're often left out of multiple regression while they're the first point of focus in ANOVA.
I've an example on the shelf in which -without mean centering- none of 3 effects (2 main, 1 interaction) contribute statistically significantly to predicting the dependent variable.
With mean centering, all 3 effects are highly "significant". These 2 analyses do result in the exact same ANOVA table but you'd have a hard time interpreting the first one.
I think z-scores aren't usually recommended because they render the b coefficients less interpretable: if we measured a predictor in dollars, b is in dollars after mean centering but no longer so after fully standardizing. I guess the beta coefficients are identical for these cases.
Thanks for the article, I'll read up on it as soon as I'll find the time!
By Zachary Gillette on September 28th, 2018
Love your website. I'd like to see a tool to mean center a case versus a variable. This helps with survey data where you have a lot of rating scales since respondents use the scales differently. When you analyze the data, sometimes the analysis focuses on how respondents use the scale versus their perceptions, and mean centering a respondent's responses can help alleviate this. Thank you for considering.
By Ruben Geert van den Berg on September 28th, 2018
Hi Zachary!
That's very easily done with DO REPEAT.
Hope that helps!
SPSS tutorials
By Paolo on May 31st, 2019
Very useful post.
I centered 3 different variables using the procedure described (doing it one by one). Then I checked using descriptives. The centered variables all have exactly zero mean (Yes!). However, for two the standard deviation of original and centered variable are exactly the same; but not for the third.
Any idea what the problem might be???
Thanks!