Also see SPSS Moderation Regression Tutorial.
- Regression with Moderation Effect
- Downloading and Installing the Mean Centering Tool
- Using the Mean Centering Tool
- Mean Centering Tool - Results
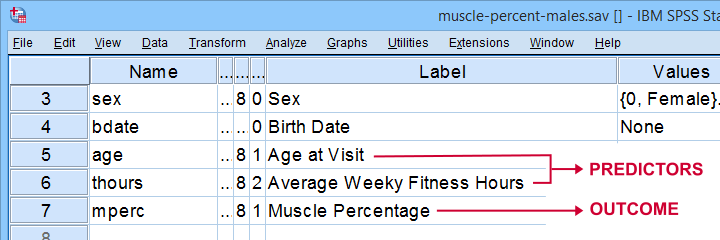
A sports doctor wants to know if and how training and age relate to body muscle percentage. His data on 243 male patients are in muscle-percent-males.sav, part of which is shown below.
Regression with Moderation Effect
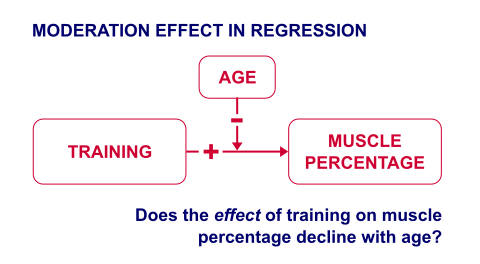
The basic way to go with these data is to run multiple regression with age and training hours as predictors. However, our doctor expects a moderation interaction effect between age and training. Precisely, he believes that the effect of training on muscle percentage diminishes with age. The diagram below illustrates the basic idea.
The moderation effect can be tested by creating a new variable that represents this interaction effect. We'll do just that in 3 steps:
- mean center both predictors: subtract the variable means from all individual scores. This results in centered predictors having zero means.
- compute the interaction predictor as the product of the mean centered predictors;
- run a multiple regression analysis with 3 predictors: the mean centered predictors and the interaction predictor.
Steps 1 and 2 can be done with basic syntax as covered in How to Mean Center Predictors in SPSS? However, we'll present a simple tool below that does these steps for you.
Downloading and Installing the Mean Centering Tool
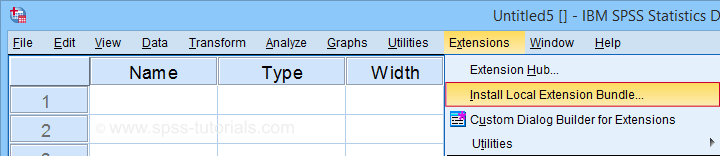
First off, you need SPSS with the SPSS-Python-Essentials for installing this tool. The tool is downloadable from SPSS_TUTORIALS_MEAN_CENTER.spe.
After downloading it, open SPSS and navigate to
![]() as shown below.
as shown below.
For older SPSS versions, try
![]() You may need to run SPSS as an administrator (by right-clicking its desktop shortcut) in order to install any tools.
You may need to run SPSS as an administrator (by right-clicking its desktop shortcut) in order to install any tools.
Using the Mean Centering Tool
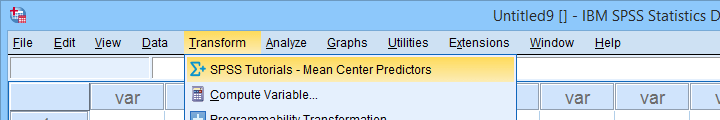
First open some data such as muscle-percent-males.sav. After installing the mean centering tool, you'll find it in the menu.
This opens a dialog as shown below. Note that string variables don't show up here: these need to be converted to numeric variable before they can be mean centered.
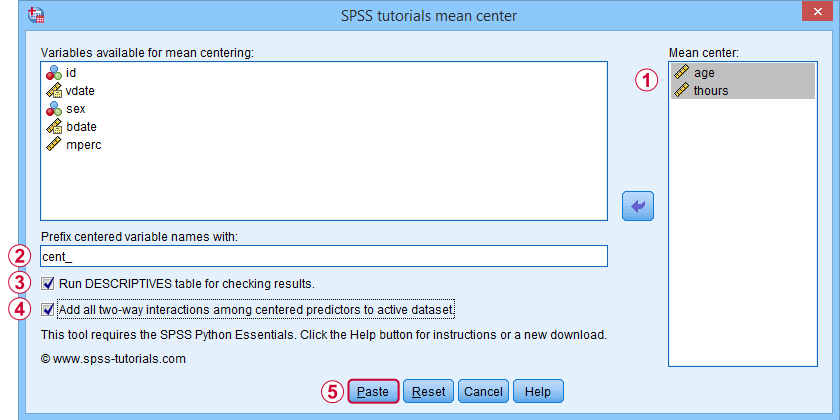
 Variable names for the centered predictors consist of a prefix + the original variable names. In this example, mean centered age and thours will be named cent_age and cent_thours.
 Optionally, create new variables holding all 2-way interaction effects among the centered predictors. For 2 predictors, this results in only 1 interaction predictor.
 Clicking results in the syntax below. Let's run it.
SPSS_TUTORIALS_MEAN_CENTER VARIABLES = "age thours"
/OPTIONS PREFIX = cent_ CHECKTABLE INTERACTIONS.
Mean Centering Tool - Results
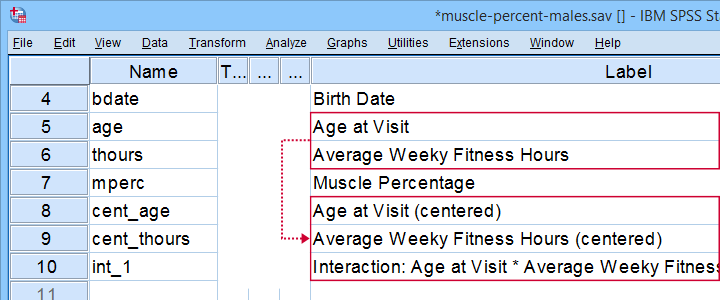
In variable view, note that 3 new variables have been created (and labeled). Precisely these 3 variables should be entered as predictors into our regression model.
If a checktable was requested, you'll find a basic Descriptive Statistics table in the output window.
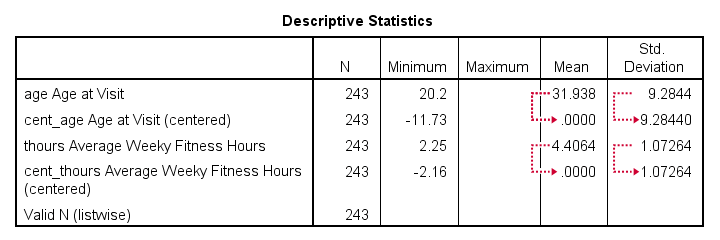
Note that the mean centered predictors have exactly zero means. Their standard deviations, however, are left unaltered by the mean centering -which is precisely how this procedure differs from computing z-scores.
Right, so that'll do for our mean centering tool. We'll cover a regression analysis with a moderation interaction effect in 1 or 2 weeks or so.
Thanks for reading!
THIS TUTORIAL HAS 40 COMMENTS:
By Ruben Geert van den Berg on August 22nd, 2015
The error suggests that you don't have the SPSS Python Essentials properly installed. As outlined by the tutorial, these are required in order for this tool to run.
By Diane Putnick on February 25th, 2016
Is there any way to run this separately for multiply imputed datasets? The aggregate function is ignoring my split file command. Can I incorporate a break variable into the python script for the aggregate command?
By Ruben Geert van den Berg on February 26th, 2016
Hi Diane!
That's a very difficult question. Since the tool is based on AGGREGATE, it should incorporate SPLIT FILE, FILTER and WEIGHT by default. We don't have a lot of experience with MULTIPLE IMPUTATION but we're kinda surprised it ignores SPLIT FILE. A workaround could be to run the tool under consecutive FILTER command (perhaps put a Python loop around the entire syntax for doing so - although this'll render the already long syntax hard to manage).
Did you actually run a SPLIT FILE command on the multiply imputed data or did you rely on the SPLIT FILE used implicitly by the imputation procedure? What happens if you run some basic output on these data, is it split in this case? And what about FILTER?
By Diane Putnick on February 26th, 2016
Hi Ruben,
Thanks for your reply!
I did explicitly use the split file command. I am new to Python, but think the issue is that the aggregate command computes the grand mean on the entire dataset unless you incorporate a break variable to specify subgroups. So for my purposes, I would like to compute the grand mean on each of 10 imputed datasets separately by breaking across the Imputation_ variable.
I haven't tried using consecutive filters yet, but I don't think that would work because the grand mean will still be computed on the full dataset rather than within imputations.
Diane
By Ruben Geert van den Berg on February 26th, 2016
Hi Diane!
I could have sworn that AGGREGATE respected SPLIT FILE but you're totally right. It doesn't. Indeed, you do need to specify the split variable explicitly as a break variable.
However, AGGREGATE does respect FILTER so the consecutive filters should work -although it's not very elegant. Perhaps you could paste the syntax from the tool and just add a BREAK specification manually into the AGGREGATE part?
I'll add a tiny test on FILTER and SPLIT FILE with AGGREGATE below that I ran for figuring things out.
Hope that helps!
Ruben
*Set up test data.data list free/id.
begin data
0 0 0 0 1 1 1 1
end data.
compute v = 2.
if (id = 1) v = 3.
*Test 1.
split file by id.
aggregate outfile *mode addvariables
/test_1 = mean(v).
*Test 2.
split file off.
filter by id.
aggregate outfile *mode addvariables/test_2 = mean(v).