Contents
- SPSS System Missing Values
- SPSS User Missing Values
- Setting User Missing Values
- Inspecting Missing Values per Variable
- SPSS Data Analysis with Missing Values
What are “Missing Values” in SPSS?
In SPSS, “missing values” may refer to 2 things:
- System missing values are values that are completely absent from the data. They are shown as periods in data view.
- User missing values are values that are invisible while analyzing or editing data. The SPSS user specifies which values -if any- must be excluded.
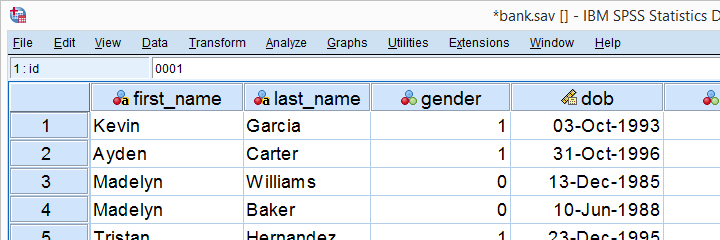
This tutorial walks you through both. We'll use bank.sav -partly shown below- throughout. You'll get the most out of this tutorial if you try the examples for yourself after downloading and opening this file.
SPSS System Missing Values
System missing values are values that are
completely absent from the data.
System missing values are shown as dots in data view as shown below.
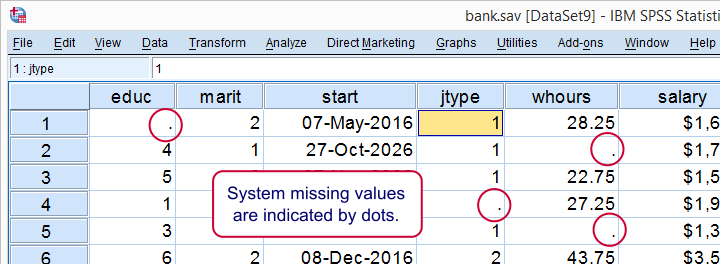
System missing values are only found in numeric variables. String variables don't have system missing values. Data may contain system missing values for several reasons:
- some respondents weren't asked some questions due to the questionnaire routing;
- a respondent skipped some questions;
- something went wrong while converting or editing the data;
- some values weren't recorded due to equipment failure.
In some cases system missing values make perfect sense. For example, say I ask
“do you own a car?”
and somebody answers “no”. Well, then my survey software should skip the next question:
“what color is your car?”
In the data, we'll probably see system missing values on color for everyone who does not own a car. These missing values make perfect sense.
In other cases, however, it may not be clear why there's system missings in your data. Something may or may not have gone wrong. Therefore, you should try to
find out why some values are system missing
especially if there's many of them.
So how to detect and handle missing values in your data? We'll get to that after taking a look at the second type of missing values.
SPSS User Missing Values
User missing values are values that are excluded
when analyzing or editing data.
“User” in user missing refers to the SPSS user. Hey, that's you! So it's you who may need to set some values as user missing. So which -if any- values must be excluded? Briefly,
- for categorical variables, answers such as “don't know” or “no answer” are typically excluded from analysis.
- For metric variables, unlikely values -a reaction time of 50ms or a monthly salary of € 9,999,999- are usually set as user missing.
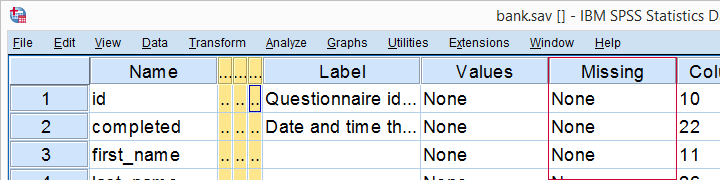
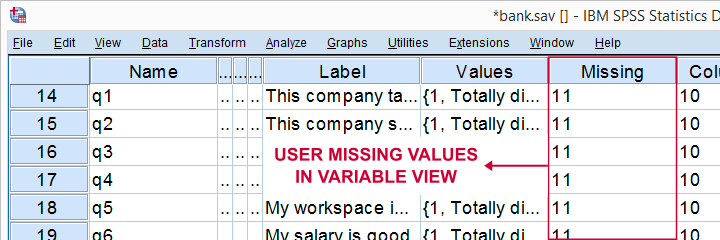
For bank.sav, no user missing values have been set yet, as can be seen in variable view.
Let's now see if any values should be set as user missing and how to do so.
User Missing Values for Categorical Variables
A quick way for inspecting categorical variables is running frequency distributions and corresponding bar charts. Make sure the output tables show both values and value labels. The easiest way for doing so is running the syntax below.
set tnumbers both.
*Basic frequency table for q1.
frequencies q1 to q9.
Result
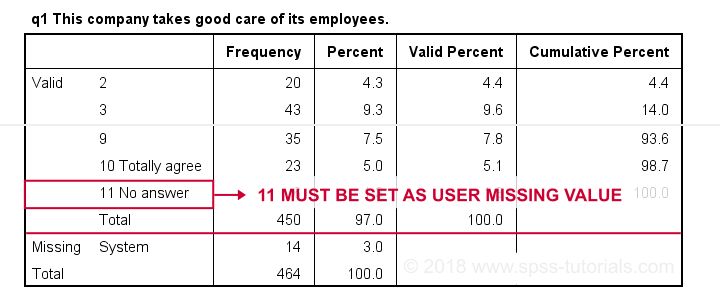
First note that q1 is an ordinal variable: higher values indicate higher levels of agreement. However, this does not go for 11: “No answer” does not indicate more agreement than 10 - “Totally agree”. Therefore, only values 1 through 10 make up an ordinal variable and 11 should be excluded.
The syntax below shows the right way to do so.
missing values q1 to q9 (11).
*Rerun frequencies table.
frequencies q1 to q9.
Result
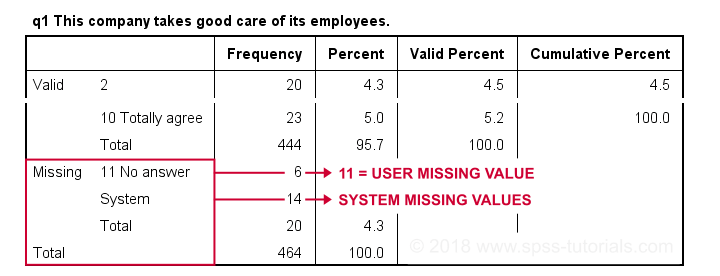
Note that 11 is shown among the missing values now. It occurs 6 times in q1 and there's also 14 system missing values. In variable view, we also see that 11 is set as a user missing value for q1 through q9.
User Missing values for Metric Variables
The right way to inspect metric variables is running histograms over them. The syntax below shows the easiest way to do so.
frequencies whours
/format notable
/histogram.
Result
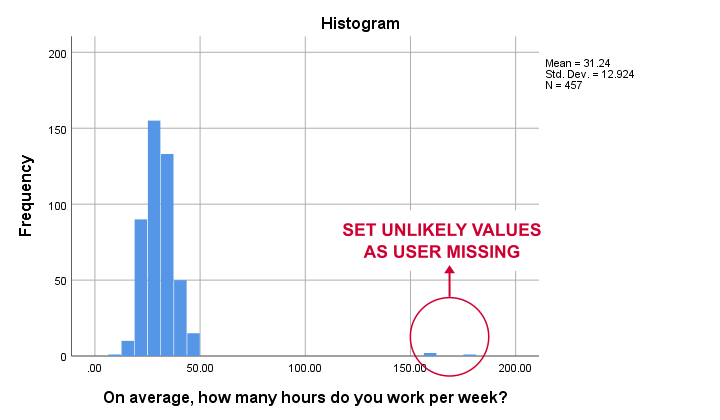
Some respondents report working over 150 hours per week. Perhaps these are their monthly -rather than weekly- hours. In any case, such values are not credible. We'll therefore set all values of 50 hours per week or more as user missing. After doing so, the distribution of the remaining values looks plausible.
missing values whours (50 thru hi).
*Rerun histogram.
frequencies whours
/format notable
/histogram.
Inspecting Missing Values per Variable
A super fast way to inspect (system and user) missing values per variable is running a basic DESCRIPTIVES table. Before doing so, make sure you don't have any WEIGHT or FILTER switched on. You can check this by running SHOW WEIGHT FILTER N. Also note that there's 464 cases in these data. So let's now inspect the descriptive statistics.
descriptives q1 to q9.
*Note: (464 - N) = number of missing values.
Result
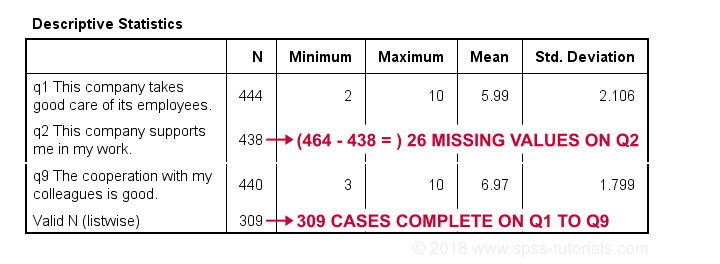
The N column shows the number of non missing values per variable. Since we've 464 cases in total, (464 - N) is the number of missing values per variable. If any variables have high percentages of missingness, you may want to exclude them from -especially- multivariate analyses.
Importantly, note that Valid N (listwise) = 309. These are the cases without any missing values on all variables in this table. Some procedures will use only those 309 cases -known as listwise exclusion of missing values in SPSS.
Conclusion: none of our variables -columns of cells in data view- have huge percentages of missingness. Let's now see if any cases -rows of cells in data view- have many missing values.
Inspecting Missing Values per Case
For inspecting if any cases have many missing values, we'll create a new variable. This variable holds the number of missing values over a set of variables that we'd like to analyze together. In the example below, that'll be q1 to q9.
We'll use a short and simple variable name: mis_1 is fine. Just make sure you add a description of what's in it -the number of missing...- as a variable label.
count mis_1 = q1 to q9 (missing).
*Set description of mis_1 as variable label.
variable labels mis_1 'Missing values over q1 to q9'.
*Inspect frequency distribution missing values.
frequencies mis_1.
Result
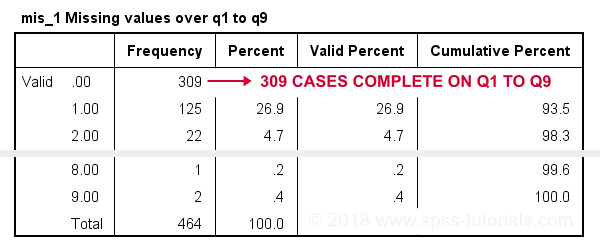
In this table, 0 means zero missing values over q1 to q9. This holds for 309 cases. This is the Valid N (listwise) we saw in the descriptives table earlier on.
Also note that 1 case has 8 missing values out of 9 variables. We may doubt if this respondent filled out the questionnaire seriously. Perhaps we'd better exclude it from the analyses over q1 to q9. The right way to do so is using a FILTER.
SPSS Data Analysis with Missing Values
So how does SPSS analyze data if they contain missing values? Well, in most situations,
SPSS runs each analysis on all cases it can use for it.
Right, now our data contain 464 cases. However, most analyses can't use all 464 because some may drop out due to missing values. Which cases drop out depends on which analysis we run on which variables.
Therefore, an important best practice is to
always inspect how many cases are actually used
for each analysis you run.
This is not always what you might expect. Let's first take a look at pairwise exclusion of missing values.
Pairwise Exclusion of Missing Values
Let's inspect all (Pearson) correlations among q1 to q9. The simplest way for doing so is just running correlations q1 to q9. If we do so, we get the table shown below.
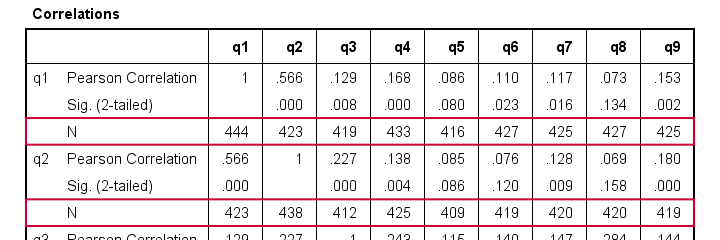
Note that each correlation is based on a different number of cases. Precisely, each correlation between a pair of variables uses all cases having valid values on these 2 variables. This is known as pairwise exclusion of missing values. Note that most correlations are based on some 410 up to 440 cases.
Listwise Exclusion of Missing Values
Let's now rerun the same correlations after adding a line to our minimal syntax:
correlations q1 to q9
/missing listwise.
After running it, we get a smaller correlation matrix as shown below. It no longer includes the number of cases per correlation.
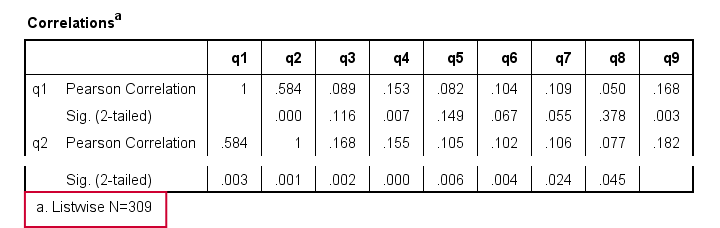
Each correlation is based on the same 309 cases, the listwise N. These are the cases without missing values on all variables in the table: q1 to q9. This is known as listwise exclusion of missing values.
Obviously, listwise exclusion often uses far fewer cases than pairwise exclusion. This is why we often recommend the latter: we want to use as many cases as possible. However, if many missing values are present, pairwise exclusion may cause computational issues. In any case, make sure you
know if your analysis uses
listwise or pairwise exclusion of missing values.
By default, regression and factor analysis use listwise exclusion and in most cases, that's not what you want.
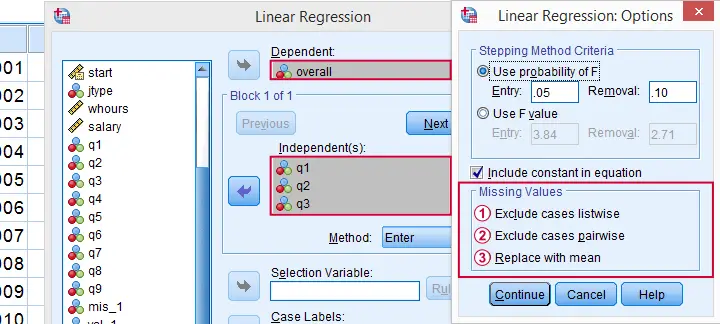
Exclude Missing Values Analysis by Analysis
Analyzing if 2 variables are associated is known as bivariate analysis. When doing so, SPSS can only use cases having valid values on both variables. Makes sense, right?
Now, if you run several bivariate analyses in one go, you can exclude cases analysis by analysis: each separate analysis uses all cases it can. Different analyses may use different subsets of cases.
If you don't want that, you can often choose listwise exclusion instead: each analysis uses only cases without missing values on all variables for all analyses. The figure below illustrates this for ANOVA.
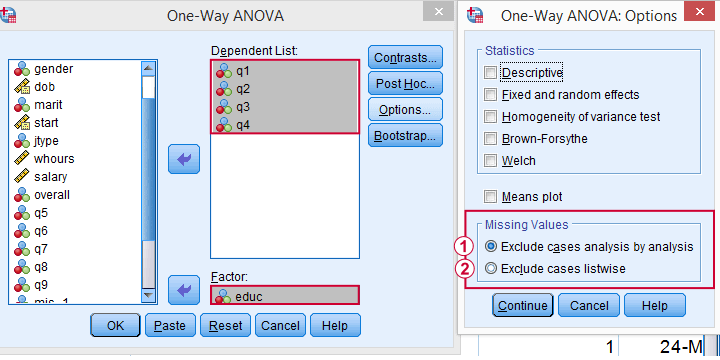
 The test for q1 and educ uses all cases having valid values on q1 and educ, regardless of q2 to q4.
 All tests use only cases without missing values on q1 to q4 and educ.
We usually want to use as many cases as possible for each analysis. So we prefer to exclude cases analysis by analysis. But whichever you choose, make sure you know how many cases are used for each analysis. So check your output carefully. The Kolmogorov-Smirnov test is especially tricky in this respect: by default, one option excludes cases analysis by analysis and the other uses listwise exclusion.
Editing Data with Missing Values
Editing data with missing values can be tricky. Different commands and functions act differently in this case. Even something as basic as computing means in SPSS can go very wrong if you're unaware of this.
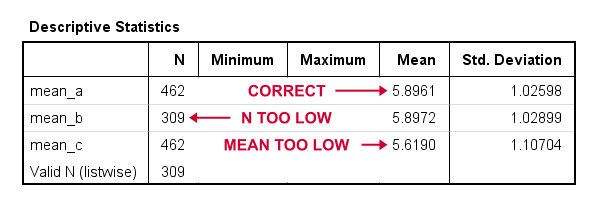
The syntax below shows 3 ways we sometimes encounter. With missing values, however, 2 of those yield incorrect results.
compute mean_a = mean(q1 to q9).
*Compute mean - wrong way 1.
compute mean_b = (q1 + q2 + q3 + q4 + q5 + q6 + q7 + q8 + q9) / 9.
*Compute mean - wrong way 2.
compute mean_c = sum(q1 to q9) / 9.
*Check results.
descriptives mean_a to mean_c.
Result
Final Notes
In real world data, missing values are common. They don't usually cause a lot of trouble when analyzing or editing data but in some cases they do. A little extra care often suffices if missingness is limited. Double check your results and know what you're doing.
Thanks for reading.
THIS TUTORIAL HAS 37 COMMENTS:
By William Peck on November 1st, 2018
Very good, I was working the examples and that's always helpful. I assume "mean(q1 to q9)" does the mean one by one and then the mean of that? And the other two are actually the same but just wacky because N's are different.
By Ruben Geert van den Berg on November 2nd, 2018
Hi Bill!
Perhaps I should explain this in some more detail:
mean(q1 to q9)takes the sum of valid (non missing) values of q1, q2, q3, ...,q9 and divides it by the number of valid values. The number of valid values is (9 variables) minus (missing values in q1 to q9). This is the right way to do it.sum(q1 to q9) / 9takes the sum of valid values and divides it by 9. However, the sum may be taken over fewer than 9 values so that's not right. Basically, missing values are treated as zeroes here.(q1 + q2 ...) / 9is not good either as it results in system missing values if one or more q1 to q9 are missing. So the final mean contains many more missing values than necessary. Means that are computed over q1 to q9 are correct, though, as they are sums over 9 valid values divided by 9.Hope that clears things up!
SPSS tutorials
By William Peck on November 2nd, 2018
Thanks for the explanation!
By KABORE STEVE on January 29th, 2019
How van I set a missing value To an observation, somthing like
If( age>100) âge="ND"
By Ruben Geert van den Berg on January 29th, 2019
You can't. You can only set missing values for (entire) variables that apply to all cases.
For your example, running
MISSING VALUES age (100 THRU HI).
sets any value of 100 or higher as missing. No need to change these values into different ones. Doing so is a typical beginners' mistake.
Hope that helps!