In ANOVA, we always report
- F (the F-value);
- df (degrees of freedom);
- p (statistical significance).
We report these 3 numbers for each effect -possibly just one for one-way ANOVA. Now, p (“Sig.” in SPSS) tells us the likelihood of some effect being zero in our population. A zero effect means that all means are exactly equal for some factor such as gender or experimental group.
However, some effect just being not zero isn't too interesting, is it? What we really want to know is:
how strong is the effect?
We can't conclude that p = 0.05 indicates a stronger effect than p = 0.10 because both are affected by sample sizes and other factors. So how can we quantify how strong effects are for comparing them within or across analyses?
Well, there's several measures of effect size that tell us just that. One that's often used is (partial) eta squared, denoted as η2 (η is the Greek letter eta).
Partial Eta Squared - What Is It?
Partial η2 a proportion of variance accounted for by some effect. If you really really want to know:
$$partial\;\eta^2 = \frac{SS_{effect}}{SS_{effect} + SS_{error}}$$
where SS is short for “sums of squares”, the amount of dispersion in our dependent variable. This means that partial η2 is the variance attributable to an effect divided by the variance that could have been attributable to this effect.
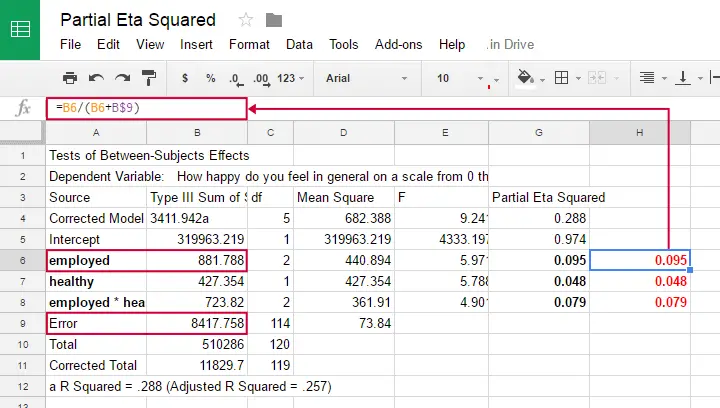
We can easily verify this -and many more calculations- by copy-pasting SPSS’ ANOVA output into this GoogleSheet as shown below.
Note that in one-way ANOVA, we only have one effect. So the variance in our dependent variable is either attributed to the effect or it is error. So for one-way ANOVA
$$partial\;\eta^2 = \frac{SS_{effect}}{SS_{total}}$$
which is equal to (non partial) η2. Let's now go and get (partial) η2 from SPSS.
Example: Happiness Study
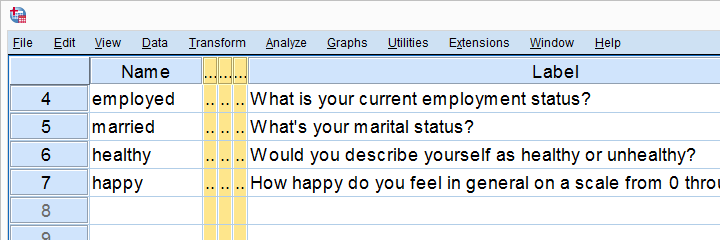
A scientist asked 120 people to rate their own happiness on a 100 point scale. Some other questions were employment status, marital status and health. The data thus collected are in happy.sav, part of which is shown below.
We're especially interested in the effect of employment on happiness: (how) are they associated and does the association depend on health or marital status too? Let's first just examine employment with a one-way ANOVA.
Eta Squared for One-Way ANOVA - Option 1
SPSS offers several options for running a one-way ANOVA and many students start off with
![]()
![]() but -oddly- η2 is completely absent from this dialog.
but -oddly- η2 is completely absent from this dialog.
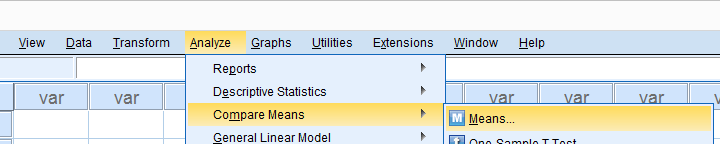
We'll therefore use MEANS instead as shown below.
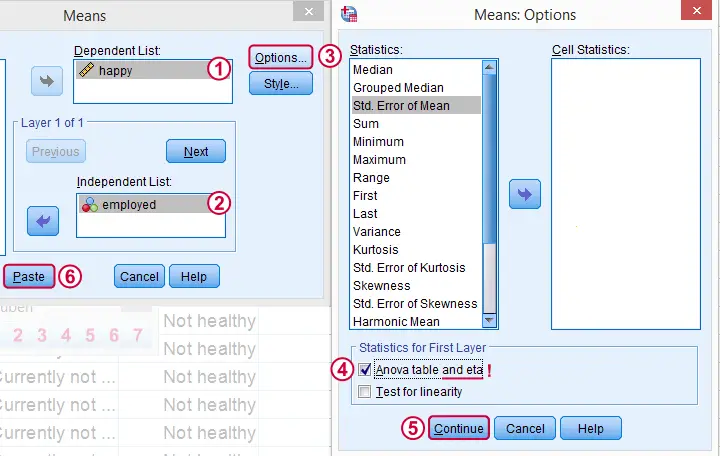
Clicking results in the syntax below. Since it's way longer than necessary, I prefer just typing a short version that yields identical results. Let's run it.
SPSS Syntax for Eta Squared from MEANS
MEANS TABLES=happy BY employed
/CELLS=MEAN COUNT STDDEV
/STATISTICS ANOVA.
*Short version (creates identical output).
means happy by employed
/statistics.
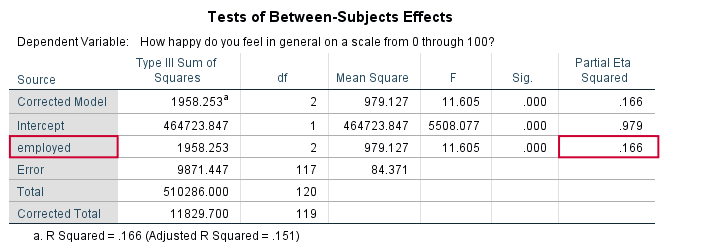
Result

And there we have it: η2 = 0.166: some 17% of all variance in happiness is attributable to employment status. I'd say it's not an awful lot but certainly not negligible.
Note that SPSS mentions “Measures of Association” rather than “effect size”. It could be argued that these are interchangeable but it's somewhat inconsistent anyway.
Eta Squared for One-Way ANOVA - Option 2
Perhaps the best way to run ANOVA in SPSS is from the univariate GLM dialog. The screenshots below guide you through.
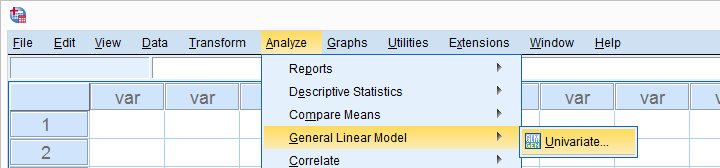
This results in the syntax shown below. Let's run it, see what happens.
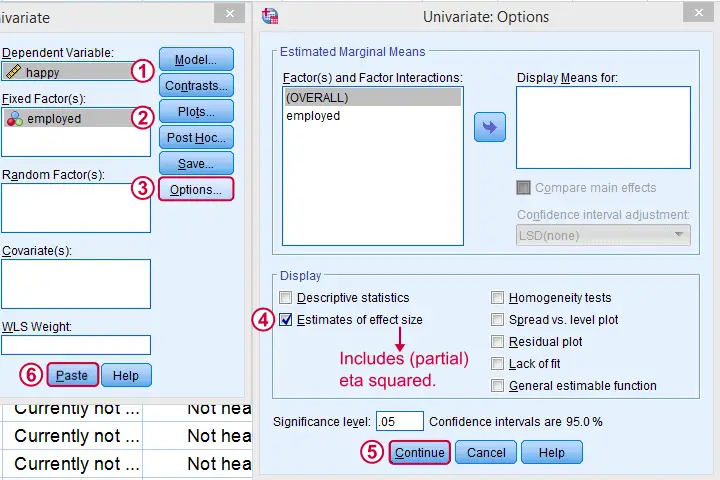
SPSS Syntax for Eta Squared from UNIANOVA
UNIANOVA happy BY employed
/METHOD=SSTYPE(3)
/INTERCEPT=INCLUDE
/PRINT=ETASQ
/CRITERIA=ALPHA(.05)
/DESIGN=employed.
Result
We find partial η2 = 0.166. It was previously denoted as just η2 but these are identical for one-way ANOVA as already discussed.
Partial Eta Squared for Multiway ANOVA
For multiway ANOVA -involving more than 1 factor- we can get partial η2 from GLM univariate as shown below.
As shown below, we now just add multiple independent variables (“fixed factors”). We then tick under and we're good to go.
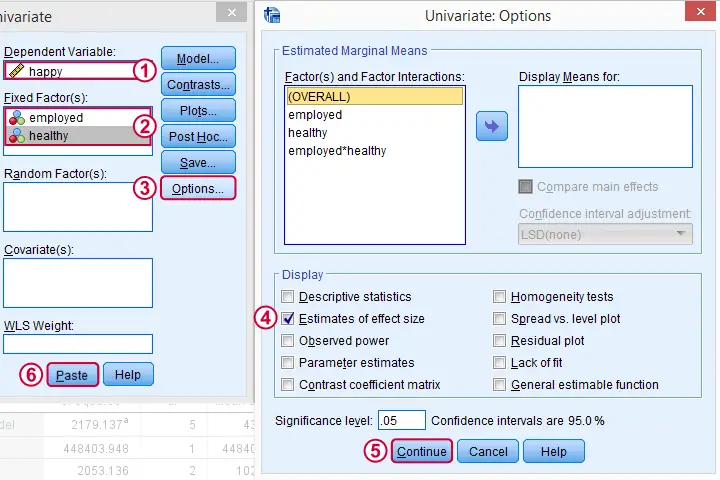
Partial Eta Squared Syntax Example
UNIANOVA happy BY employed healthy
/METHOD=SSTYPE(3)
/INTERCEPT=INCLUDE
/PRINT=ETASQ
/CRITERIA=ALPHA(.05)
/DESIGN=employed healthy employed*healthy.
Result
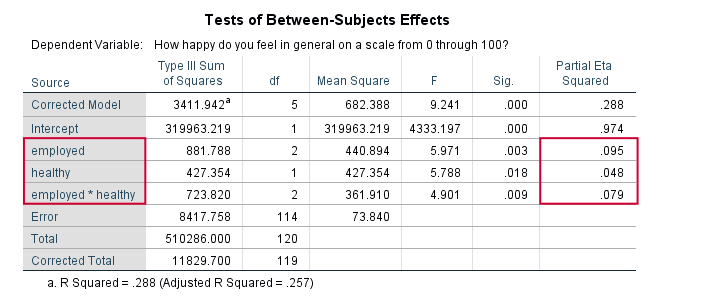
First off, both main effects (employment and health) and the interaction between them are statistically significant. The effect of employment (η2 = .095) is twice as strong as health (η2 = 0.048). And so on.
Note that you couldn't possibly conclude this from their p-values (p = 0.003 for employment and p = 0.018 for health). Although the effects are highly statistically significant, the effect sizes are moderate. We typically see this pattern with larger sample sizes.
Last, we shouldn't really interpret our main effects because the interaction effect is statistically significant: F(2,114) = 4.9, p = 0.009. As explained in SPSS Two Way ANOVA - Basics Tutorial, we'd better inspect simple effects instead of main effects.
Conclusion
We can get (partial) η2 for both one-way and multiway ANOVA from
![]()
![]() but it's restricted to one dependent variable at the time. Generally, I'd say this is the way to go for any ANOVA because it's the only option that gets us all the output we generally need -including post hoc tests and Levene's test.
but it's restricted to one dependent variable at the time. Generally, I'd say this is the way to go for any ANOVA because it's the only option that gets us all the output we generally need -including post hoc tests and Levene's test.
We can run multiple one-way ANOVAs with η2 in one go with
![]()
![]() but it lacks important options such as post hoc tests and Levene's test. These -but not η2 - are available from the dialog. This renders both options rather inconvenient unless you need a very basic analysis.
but it lacks important options such as post hoc tests and Levene's test. These -but not η2 - are available from the dialog. This renders both options rather inconvenient unless you need a very basic analysis.
Last, several authors prefer a different measure of effect size called ω2 (“Omega square”). Unfortunately, this seems completely absent from SPSS. For now at least, I guess η2 will have to do...
I hope you found this tutorial helpful. Thanks for reading!
THIS TUTORIAL HAS 24 COMMENTS:
By Hok Hakly on June 30th, 2017
Thanks
By Wohid Chowdhury on June 30th, 2017
Thanks for sharing wonderful learning document.
By Jen Bennett on July 1st, 2017
Thank you! I love how you laid everything out and made each step easy to understand! Great refresher for me.
By Katie on July 25th, 2017
Thanks for this, what you've written is really clear, but I do have a couple of questions... What is the difference between partial eta squared and eta squared? I'm conducting factorial ANOVA and have been advised that eta squared would be a better measure of the effect size than partial eta squared. Why is this? And why does SPSS not give the option to calculate it? Can I calculate it from knowing partial eta squared?
By Ruben Geert van den Berg on July 25th, 2017
Hi Katie!
Eta squared is SSfactor / SStotal. However, part of SStotal may already be accounted for by a different factor when there's more than 1 factor involved. So that's kinda odd.
Partial eta squared = SSfactor / (SSfactor + SSerror), so that's the proportion of variance that some factor could have accounted for. Most researchers will agree this makes more sense.
I anybody does not agree, ask them to come up with a decent reference on why they believe eta squared would be better.
One of many references that prefer partial eta squared is Howell, D.C. (2002). Statistical Methods for Psychology (5th ed.). Pacific Grove CA: Duxbury.
Hope that helps!