In ANOVA, we always report
- F (the F-value);
- df (degrees of freedom);
- p (statistical significance).
We report these 3 numbers for each effect -possibly just one for one-way ANOVA. Now, p (“Sig.” in SPSS) tells us the likelihood of some effect being zero in our population. A zero effect means that all means are exactly equal for some factor such as gender or experimental group.
However, some effect just being not zero isn't too interesting, is it? What we really want to know is:
how strong is the effect?
We can't conclude that p = 0.05 indicates a stronger effect than p = 0.10 because both are affected by sample sizes and other factors. So how can we quantify how strong effects are for comparing them within or across analyses?
Well, there's several measures of effect size that tell us just that. One that's often used is (partial) eta squared, denoted as η2 (η is the Greek letter eta).
Partial Eta Squared - What Is It?
Partial η2 a proportion of variance accounted for by some effect. If you really really want to know:
$$partial\;\eta^2 = \frac{SS_{effect}}{SS_{effect} + SS_{error}}$$
where SS is short for “sums of squares”, the amount of dispersion in our dependent variable. This means that partial η2 is the variance attributable to an effect divided by the variance that could have been attributable to this effect.
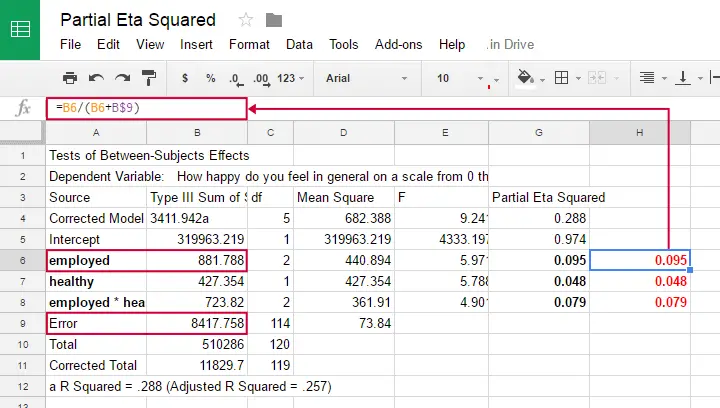
We can easily verify this -and many more calculations- by copy-pasting SPSS’ ANOVA output into this GoogleSheet as shown below.
Note that in one-way ANOVA, we only have one effect. So the variance in our dependent variable is either attributed to the effect or it is error. So for one-way ANOVA
$$partial\;\eta^2 = \frac{SS_{effect}}{SS_{total}}$$
which is equal to (non partial) η2. Let's now go and get (partial) η2 from SPSS.
Example: Happiness Study
A scientist asked 120 people to rate their own happiness on a 100 point scale. Some other questions were employment status, marital status and health. The data thus collected are in happy.sav, part of which is shown below.
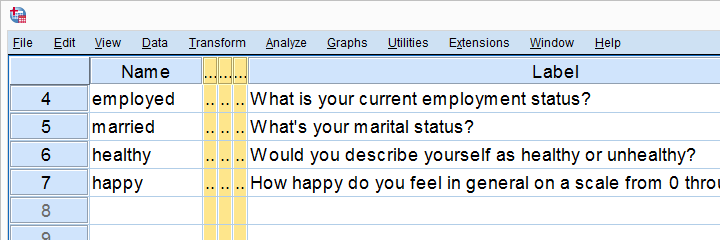
We're especially interested in the effect of employment on happiness: (how) are they associated and does the association depend on health or marital status too? Let's first just examine employment with a one-way ANOVA.
Eta Squared for One-Way ANOVA - Option 1
SPSS offers several options for running a one-way ANOVA and many students start off with
![]()
![]() but -oddly- η2 is completely absent from this dialog.
but -oddly- η2 is completely absent from this dialog.
We'll therefore use MEANS instead as shown below.

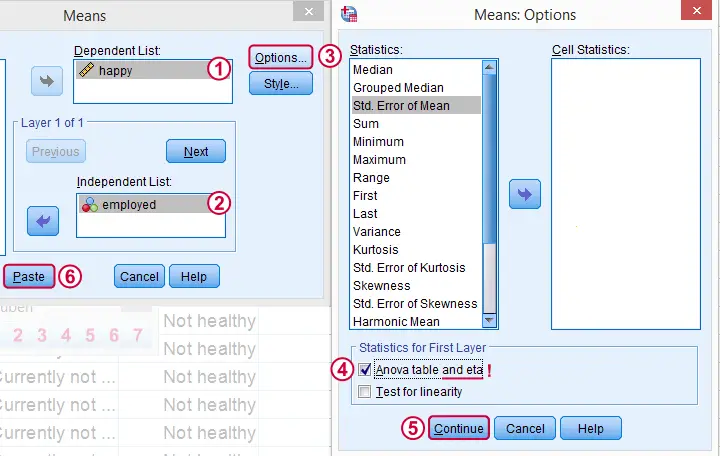
Clicking results in the syntax below. Since it's way longer than necessary, I prefer just typing a short version that yields identical results. Let's run it.
SPSS Syntax for Eta Squared from MEANS
MEANS TABLES=happy BY employed
/CELLS=MEAN COUNT STDDEV
/STATISTICS ANOVA.
*Short version (creates identical output).
means happy by employed
/statistics.
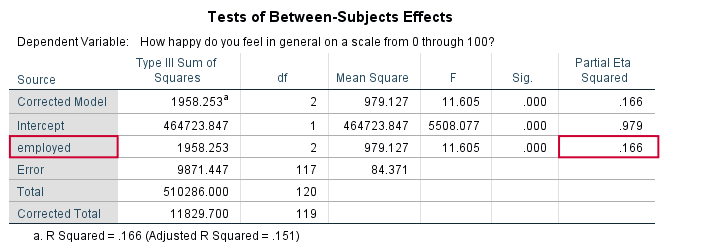
Result

And there we have it: η2 = 0.166: some 17% of all variance in happiness is attributable to employment status. I'd say it's not an awful lot but certainly not negligible.
Note that SPSS mentions “Measures of Association” rather than “effect size”. It could be argued that these are interchangeable but it's somewhat inconsistent anyway.
Eta Squared for One-Way ANOVA - Option 2
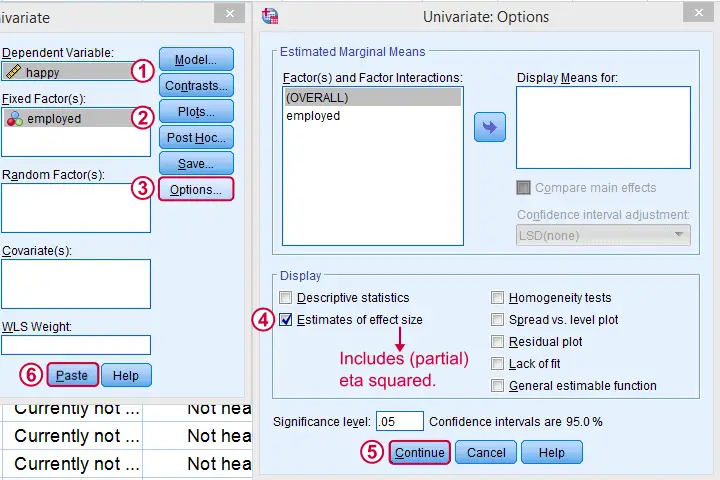
Perhaps the best way to run ANOVA in SPSS is from the univariate GLM dialog. The screenshots below guide you through.
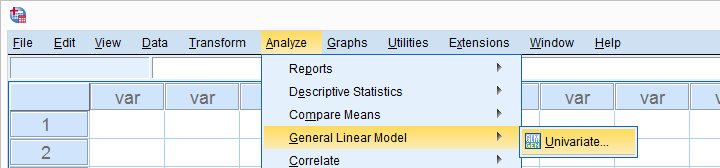
This results in the syntax shown below. Let's run it, see what happens.
SPSS Syntax for Eta Squared from UNIANOVA
UNIANOVA happy BY employed
/METHOD=SSTYPE(3)
/INTERCEPT=INCLUDE
/PRINT=ETASQ
/CRITERIA=ALPHA(.05)
/DESIGN=employed.
Result
We find partial η2 = 0.166. It was previously denoted as just η2 but these are identical for one-way ANOVA as already discussed.
Partial Eta Squared for Multiway ANOVA
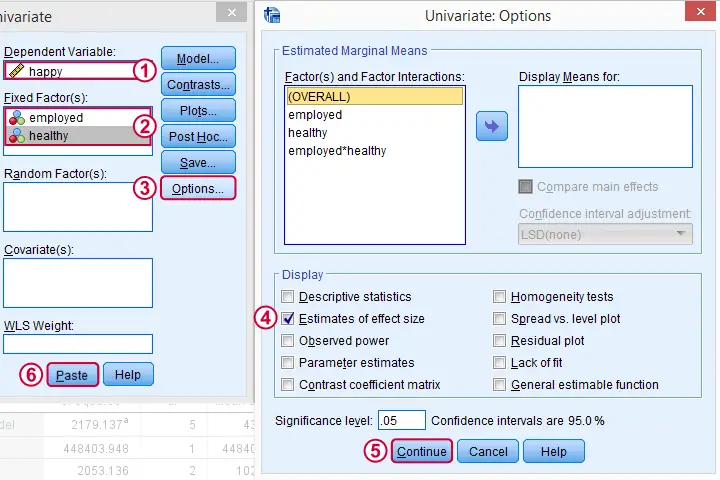
For multiway ANOVA -involving more than 1 factor- we can get partial η2 from GLM univariate as shown below.
As shown below, we now just add multiple independent variables (“fixed factors”). We then tick under and we're good to go.
Partial Eta Squared Syntax Example
UNIANOVA happy BY employed healthy
/METHOD=SSTYPE(3)
/INTERCEPT=INCLUDE
/PRINT=ETASQ
/CRITERIA=ALPHA(.05)
/DESIGN=employed healthy employed*healthy.
Result
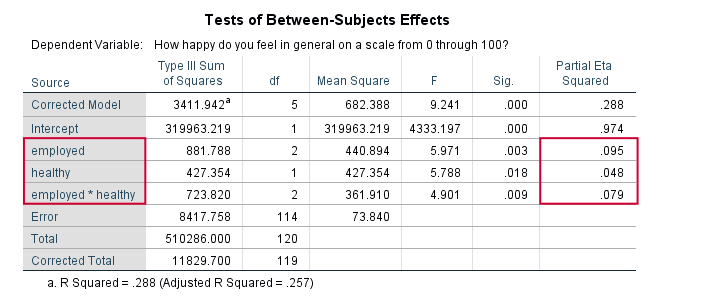
First off, both main effects (employment and health) and the interaction between them are statistically significant. The effect of employment (η2 = .095) is twice as strong as health (η2 = 0.048). And so on.
Note that you couldn't possibly conclude this from their p-values (p = 0.003 for employment and p = 0.018 for health). Although the effects are highly statistically significant, the effect sizes are moderate. We typically see this pattern with larger sample sizes.
Last, we shouldn't really interpret our main effects because the interaction effect is statistically significant: F(2,114) = 4.9, p = 0.009. As explained in SPSS Two Way ANOVA - Basics Tutorial, we'd better inspect simple effects instead of main effects.
Conclusion
We can get (partial) η2 for both one-way and multiway ANOVA from
![]()
![]() but it's restricted to one dependent variable at the time. Generally, I'd say this is the way to go for any ANOVA because it's the only option that gets us all the output we generally need -including post hoc tests and Levene's test.
but it's restricted to one dependent variable at the time. Generally, I'd say this is the way to go for any ANOVA because it's the only option that gets us all the output we generally need -including post hoc tests and Levene's test.
We can run multiple one-way ANOVAs with η2 in one go with
![]()
![]() but it lacks important options such as post hoc tests and Levene's test. These -but not η2 - are available from the dialog. This renders both options rather inconvenient unless you need a very basic analysis.
but it lacks important options such as post hoc tests and Levene's test. These -but not η2 - are available from the dialog. This renders both options rather inconvenient unless you need a very basic analysis.
Last, several authors prefer a different measure of effect size called ω2 (“Omega square”). Unfortunately, this seems completely absent from SPSS. For now at least, I guess η2 will have to do...
I hope you found this tutorial helpful. Thanks for reading!
THIS TUTORIAL HAS 24 COMMENTS:
By saba on November 25th, 2018
Dear Ruben;
As you have mentioned: "Roughly, partial η2 is the proportion of variance accounted for by some effect. "
But, how we can explain to the audiences for a two way ANOVA in which sum of two partial η2 s are larger than one.
One intuitively expects than the sum of proportions up to one.
I understand the formula, But this is not proportion of model/population variance.
By Ruben Geert van den Berg on November 25th, 2018
Hi Saba!
Funny you commented on this one, I'm currently working on an update which I wanted to post tomorrow -but I'm too busy for that. But anyway.
I think it's not possible that the sum of two partial η2 s is larger than one. But if you have a counter example, please share it.
Also, I never mentioned model/population variance. Both sums of squares are sample sums of squares or -roughly- variance components.
If you have an alternative description for partial eta squared that a broad audience will understand, please let me know. Thx!
By saba on November 25th, 2018
Dear Ruben;
As an example for the sum of two partial η2 s to be larger than one, please see "tests between subject effects" table on this webpage:
https://statistics.laerd.com/spss-tutorials/ancova-using-spss-statistics-2.php
Two partial η2 s are: 0.963 and 0.837
By the way; thank you for updating your post. I think it would be more helpful if also publish the last update date each post at top of it. So, your eager readers will be sure that don't miss it.
By Ruben Geert van den Berg on November 26th, 2018
Hi Saba!
Thanks for the example. Indeed, perhaps I'd better say a proportion of variance rather than the proportion of variance. But I never said "proportion of total variance".
Whenever I update a tutorial, I'll put it on the home page http://www.spss-tutorials.com. I usually post it on our facebook page and sometimes LinkedIn as well.
Perhaps we'll start a newsletter at some point too.
P.s. your feedback is great! Bummer we're not connected on LinkedIn or anything!
By saba on November 26th, 2018
Hello, Ruben,
I believe that it is more logical to define partial square eta for each effect as: SS_{effect}/SS_{model}.
This way of defining partial square eta have two advantages:
1- similar to standard partial eta, it can be used for comparing the effects of different effects in the model.
2- One can simply understand to which extent each factor explains the model variability.
I have no resource for that. These are just the idea of my crazy mind!
Sorry for not having a facebook acount, but your posts are so useful, and I really enjoy discussing with you!