How to draw one or many samples from your data in SPSS? This tutorial demonstrates some simple ways for doing so. We'll point out some tips, tricks and pitfalls along the way.
Let's get started and create some test data by running the syntax below.
SPSS Syntax for Creating Test Data
data list free/id.
begin data
0 0 0 0 0 0 0 0 0 0 0 0 0 0 0 0 0 0 0 0 0 0 0 0 0 0 0 0 0 0 0 0 0 0 0 0 0 0 0 0 0 0 0 0 0 0 0 0 0 0
0 0 0 0 0 0 0 0 0 0 0 0 0 0 0 0 0 0 0 0 0 0 0 0 0 0 0 0 0 0 0 0 0 0 0 0 0 0 0 0 0 0 0 0 0 0 0 0 0 0
end data.
compute id = $casenum.
execute.
Result
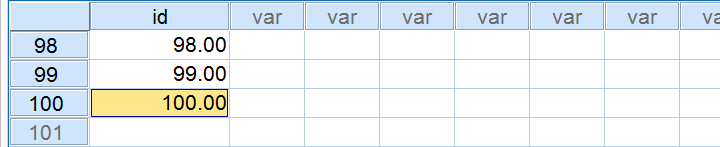
We now have 1 variable and 100 cases. For each case, our variable contains $casenum. The screenshot below shows the last handful of cases in our data.
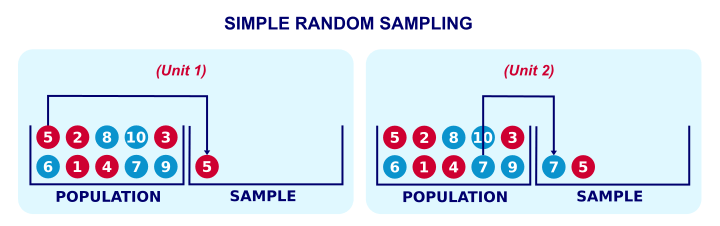
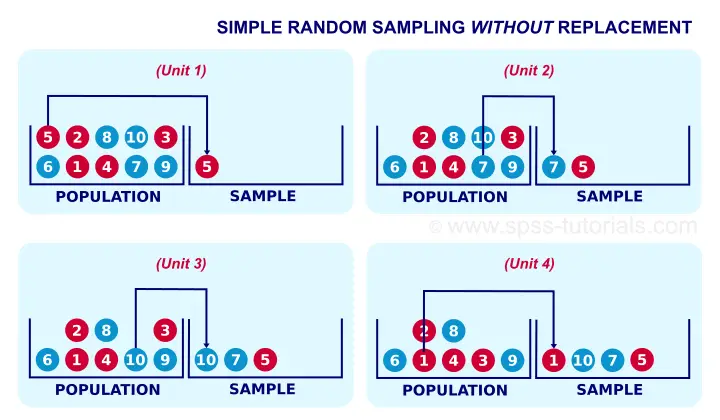
Simple Sampling Without Replacement
Simple random sampling means that each unit in our population has the same probability of being sampled. “Without replacement” means that a sampled unit is not replaced into the population and thus can be sampled only once. The figure below illustrates the process.
Simple random sampling without replacement is the easiest option for sampling in SPSS. The syntax below shows the first option for doing so.
Simple Random Sampling without Replacement - Example I
set rng mc seed 1.
*2. Draw sample.
sample 20 from 100.
execute.
Result
Notes
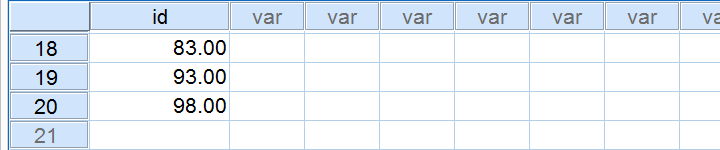
This first example is the easiest way to draw just one sample when we know the number of cases in our data (100 in our example). Note that we have 20 cases left after running it.
If we rerun our sampling syntax, we usually want the exact same random sample to come up. One way for ensuring this is running
SET RNG MC SEED 1.
just prior to sampling.
Simple Random Sampling without Replacement - Example II
Let's first rerun our test data syntax. Next, the syntax below shows a second option for sampling without replacement.
compute s1 = rv.uniform(0,1).
*2. Rank random numbers.
rank s1.
*3. Select 20 cases with lowest random numbers.
select if (rs1 <= 20).
execute.
Notes
As we'll see later on, this second example is a first step towards repeated sampling and stratified random sampling. On top, it doesn't require knowing how many cases we have in our data.
Simple Random Sampling without Replacement - Example III
Again, we'll rerun our test data syntax, followed by the syntax below.
set seed 1.
compute s1 = rv.uniform(0,1).
*2. Rank random numbers.
rank s1.
*3. Recode rank variable into filter variable.
recode rs1 (lo thru 20 = 1)(else = 0).
*4. Switch filter on.
filter by rs1.
*5. Inspect output.
descriptives id.
Result
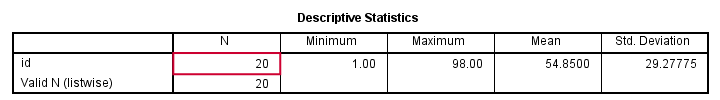
Notes
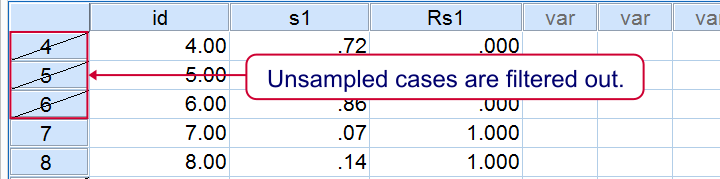
This third examples uses FILTER instead of deleting unsampled cases with SELECT IF. This leaves all our cases -including a variable that indicates our sample- nicely intact in our data. As shown below, the strikethrough in data view as well as the status bar tell us that a filter is actually in effect.
Repetitive Sampling in SPSS
Repeated random sampling is the basis for most simulation studies. We presented such simulations for explaining the basic idea behind ANOVA and the chi-square test.
Simulation studies usually require looping over SPSS procedures, which are basically commands that inspect all cases in our dataset. The right way for doing so is with Python as shown in the syntax below. Running it requires the SPSS Python Essentials to be properly installed.
SPSS Repeated Sampling with Python Syntax
begin program.
import spss
for sample in range(10):
spss.Submit('''
temporary.
sample 20 from 100.
descriptives id.
''')
end program.
Notes
We use TEMPORARY here for drawing our repeated samples. Note that we're basically simulating a sampling distribution over mean scores here. These mean scores (over 20 cases each) will be roughly normally distributed due to the central limit theorem.
SPSS Repeated Sampling Example 2
The syntax below uses a different approach for repeated sampling that'll be the basis for simple random sampling with replacement later on. All sample variables will be left in our data -a feature we may or may not like.
SPSS Repeated Sampling with Python Syntax
do repeat #s = s1 to s10.
compute #s = rv.uniform(0,1).
end repeat.
*2. Rank previous variables.
rank s1 to s10.
*3. Convert rank variables into filter variables.
recode rs1 to rs10 (lo thru 20 = 1)(else = 0).
*4. Run filtered descriptives.
begin program.
import spss
for sample in range(1,11):
spss.Submit('''
filter by rs%d.
descriptives id.
'''%sample)
end program.
*5. Switch off filter.
filter off.
Simple Sampling With Replacement
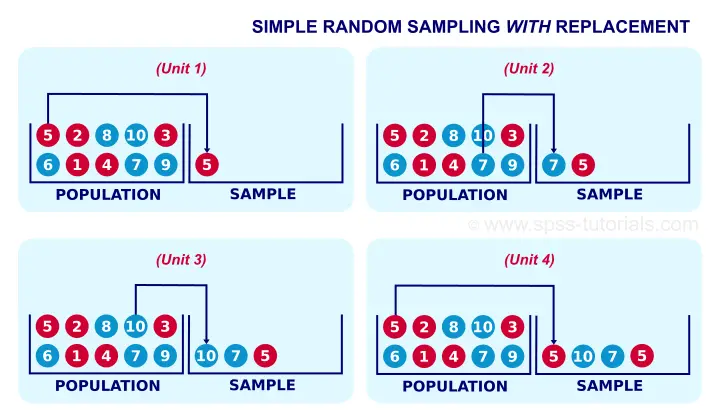
Strictly, most inferential statistics quietly assume that our data are obtained by simple random sampling with replacement. A textbook example is drawing a marble from a vase, writing down its color and putting it back into the vase before sampling a second (third...) marble. Like so, each marble may be sampled several times. The figure below illustrates the idea.
In real-world research, simple sampling with replacement is not common. This is because
respondents who are “sampled” a second or third time
will probably just tell the statistician to “f@#k off”.
Anyway. The syntax below demonstrates simple random sampling with replacement in SPSS. It uses both WEIGHT and FILTER in order for the sample to take effect.
Simple Random Sampling With Replacement Syntax
set seed 1.
do repeat #s = s1 to s50.
compute #s = rv.uni(0,1).
end repeat.
*2. Rank random numbers.
rank s1 to s50.
*3. Each rank variable represents a single draw with replacement.
recode rs1 to rs50 (2 thru hi = 0).
*4. The sum of our 50 draws is our sample variable.
compute sample = sum(rs1 to rs50).
*5. Inspect sample variable in data view.
sort cases by sample (d).
*6. Sample variable should sum to n = 50 cases.
descriptives sample/statistics min max mean sum.
*7. Filter not necessary but circumvents warning when WEIGHT is used.
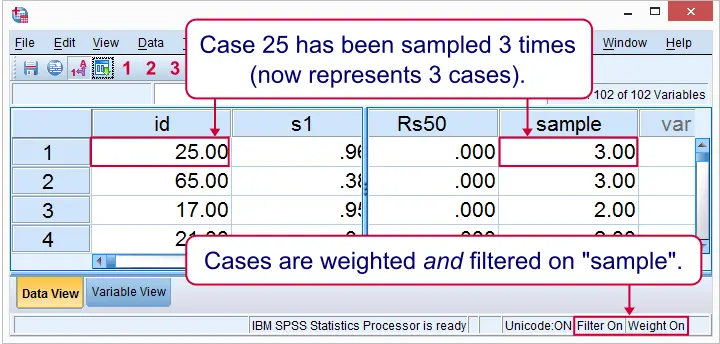
filter by sample.
*8. Use sample as weight variable.
weight by sample.
*9. Descriptives on 50 cases.
descriptives id.
Result in Data View
Right. So those are some basics on sampling in SPSS. I hope you found them helpful.
In any case, thanks for reading and keep up the good work!
THIS TUTORIAL HAS 7 COMMENTS:
By JB on April 11th, 2017
Hello! Thanks for your help! I followed the example in Draw a Stratified Random Sample, but I always get the head as the sample in all the households.
By Ruben Geert van den Berg on April 11th, 2017
Then perhaps you're doing something wrong? Make sure the variable you're actually RANKing is something like
COMPUTE TMP = RV.UNIFORM(0,1).
and not the variable that tells you if someone is the head of the household.
By Sabindta on July 30th, 2019
Can I do systematic sampling in spss?
By Ruben Geert van den Berg on July 30th, 2019
Precisely what do you mean by that?
By Justin on June 30th, 2020
Very helpful, although I'd like to integrate analysis of the subsets. My specific use case is as follows:
First, I use one of your python iterations to generate 1000 bootstrapped samples of 4 observations from a dataset of 122 observations and calculate the mean of several variables (C, S, and A) each time. My exact syntax is:
begin program.
import spss
for sample in range(1000):
spss.Submit('''
temporary.
sample 4 from 122.
descriptives C S A.
''')
end program.
I'd like to still do two things though. First, suppress the output (I don't need to see the 1,000 sample descriptive statistics!). Second, and most importantly, I'd like to run analyses on the 1,000 sample descriptive. Specifically, I'd like to calculate the standard deviations of the means of each of the given variables (i.e., C, S, and A) as randomly drawn in the groups of 4 1,000 times. Notably, the resulting standard deviation of group means would be smaller than the overall standard deviation of each variable without the subsetting.
Thanks in advance for any help you can provide!