Why should you learn anything about your SPSS settings? Well, doing so allows you to
- create better output with less effort;
- speed up a huge variety of tasks;
- accomplish tasks that are otherwise impossible.
So which settings are interesting to learn about? The table below presents our top 10.
Top 10 Most Useful SPSS Settings
| SETTING | OPTIONS | DESCRIPTION |
|---|---|---|
| TNUMBERS | BOTH / LABELS / VALUES | How to show values in pivot tables |
| TVARS | BOTH / LABELS / NAMES | How to show variables in pivot tables |
| OVARS | BOTH / LABELS / NAMES | How to show variables in output viewer outline |
| TLOOK | (path to .stt file) / NONE | Tablelook file: styling for pivot tables |
| SIGLESS | ON / OFF | Whether to display small significance levels as < 0.001 in tables |
| CTEMPLATE | (path to .sgt file) / NONE | Chart template file: styling for charts |
| LOCALE | (locale) / OSLOCALE | Country and character set |
| SEED | (chosen integer) / RANDOM | Random seed used if RNG = MC |
| PRINTBACK | NONE / LISTING | Whether to print syntax to output viewer |
| ODISPLAY | MODELVIEWER / TABLES | Whether to use model viewer for some output |
Background & Googlesheet for All Settings
The vast majority of settings can be adjusted by navigating to
![]() as shown below.
as shown below.
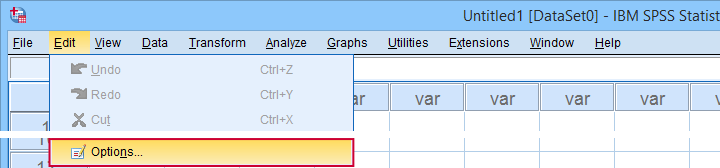
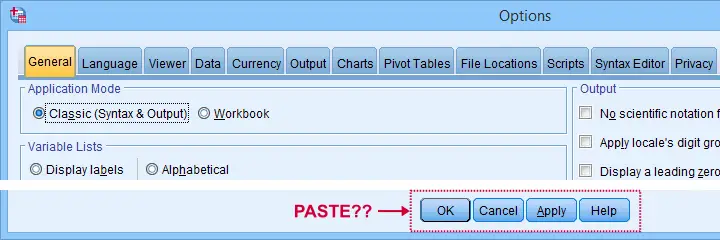
Sadly, the options dialog is a bit of a labyrinth and finding your way here can be time consuming. Another major stupidity is that there's no Paste button here either.
For these reasons, using SPSS syntax is a much better option for adjusting your settings. But where to start? Well, first off, we created an overview of all settings in this Googlesheet, partly shown below.
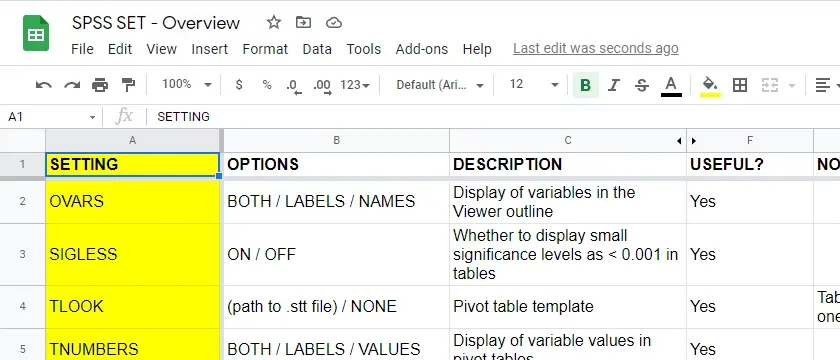
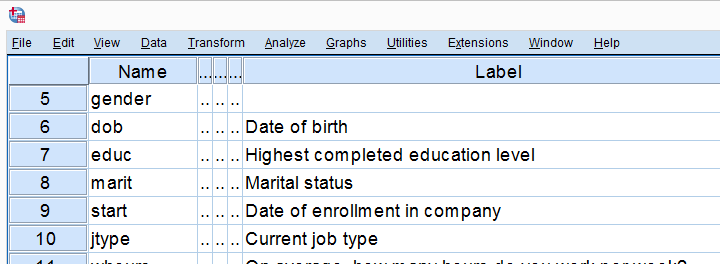
Note that Column F suggests if we think some setting is useful. The remainder of this tutorial demonstrates the 10 most useful settings, ordered from most to least important. All examples use bank-clean.sav, partly shown below.
SET TNUMBERS - Table Numbers
TNUMBERS controls how values are shown in output tables. The syntax below presents a quick demo.
set tnumbers both.
*Run minimal frequency table.
frequencies marit.
*Show only value labels in all succeeding tables.
set tnumbers labels.
*Run minimal frequency table.
frequencies marit.
Result
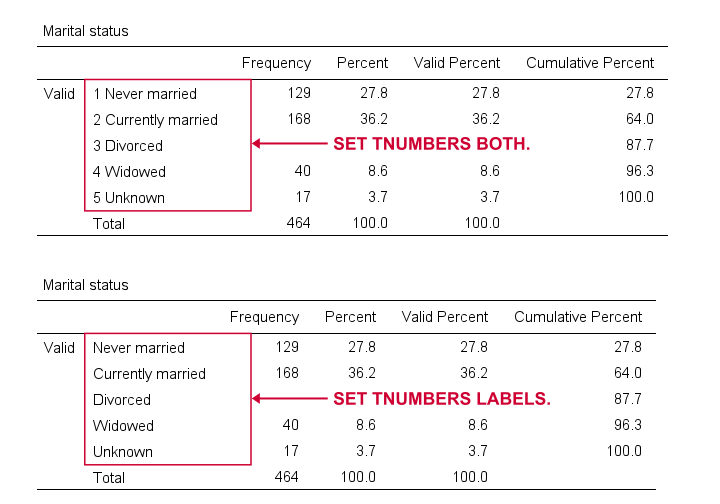
Reporting values and value labels is the recommended setting for screening data. However, for creating “clean” tables to include in your final report, you probably want to show only value labels.
SET TVARS - Table Variables
TVARS controls how variables are shown in output tables. For a quick demo, try the syntax below.
set tvars both.
*Run minimal descriptives table.
descriptives q1 to q3.
*Show only variable labels in succeeding output tables.
set tvars labels.
*Run minimal descriptives table.
descriptives q1 to q3.
Result
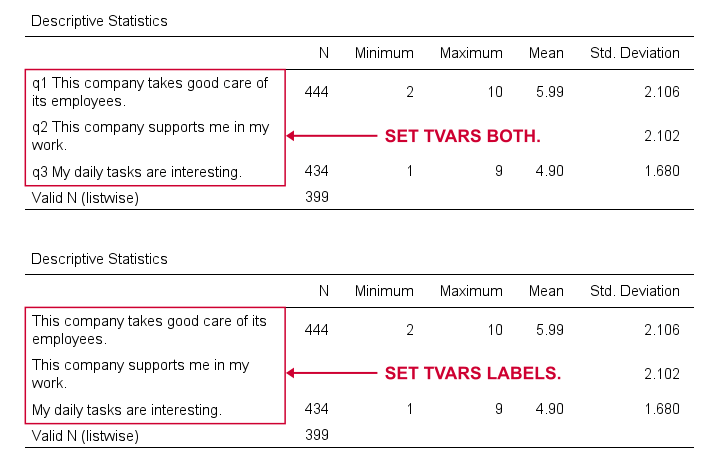
For screening data, showing both variable names and labels is often the way to go. For creating reporting tables, however, we recommend showing only variable labels.
SET OVARS - Outline Variables
OVARS controls how variables are shown in the output outline. The syntax below gives a quick demo.
set ovars both.
*Frequency tables & barcharts.
frequencies q1 to q3
/barchart.
*Show only variable names in viewer outline.
set ovars names.
*Frequency tables & barcharts.
frequencies q1 to q3
/barchart.
Result
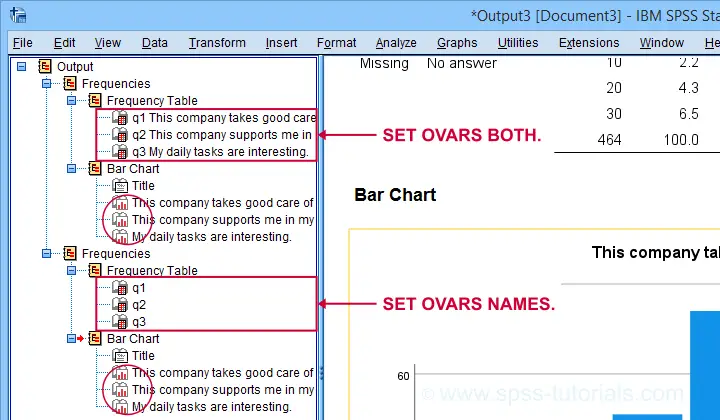
Note that the OVARS setting ignores the bar charts created with the frequency tables. The same goes for histograms. We believe this to be a tiny -but sometimes annoying- bug in SPSS.
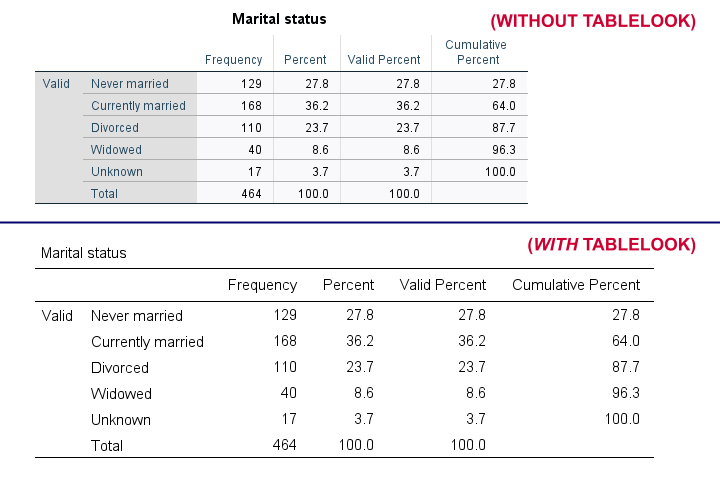
SET TLOOK - Tablelook
Tablelooks or .stt files are plain text files containing styling for tables such as fonts, background colors and borders. The syntax demo below requires that clean-11pt.stt is located in a folder d:/templates on your computer.
set tlook none.
*Run minimal frequency table.
frequencies marit.
*Set nicer tablelook.
set tlook 'd:/templates/clean-11pt.stt'.
*Run minimal frequency table.
frequencies marit.
Result
Notes
- You can also apply tablelooks to existing tables by using the menu or (faster) OUTPUT MODIFY.
- Sadly, the TLOOK setting ignores the CD command: you always need to specify both the folder and the file name...
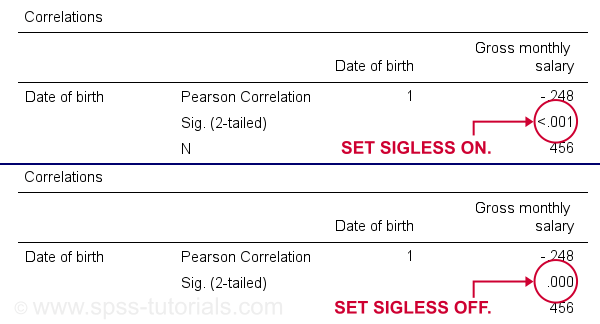
SET SIGLESS - Significance Less Than...
SIGLESS (introduced in SPSS 27) controls how small significance levels are shown in output tables. We believe there's a bug regarding this setting: the syntax below ignores it unless you run each line separately.
set sigless on.
*Run minimal correlation matrix.
correlations dob salary.
*Show small p-values as .000.
set sigless off.
*Run minimal correlation matrix.
correlations dob salary.
Result
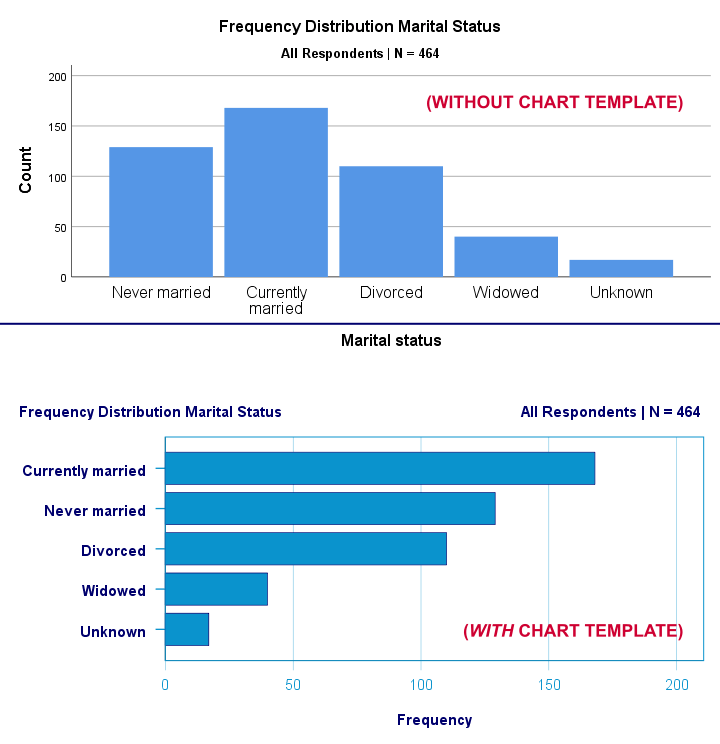
SET CTEMPLATE - Chart Template
Chart templates or .sgt files are plain text files containing styling for charts such as colors, sizes and layout. The quick demo below requires that barchart-freq-dsort-en-h360.sgt is located in a folder d:/templates on your computer.
set ctemplate none.
*Minimal bar chart frequencies.
GRAPH
/BAR(SIMPLE)=COUNT BY marit
/TITLE='Frequency Distribution Marital Status'
/SUBTITLE='All Respondents | N = 464'.
*Set chart template for bar charts.
set ctemplate 'd:/templates/barchart-freq-dsort-en-h360.sgt'.
*Minimal bar chart frequencies.
GRAPH
/BAR(SIMPLE)=COUNT BY marit
/TITLE='Frequency Distribution Marital Status'
/SUBTITLE='All Respondents | N = 464'.
Result
Notes
- After creating the charts you need, you probably want to set your CTEMPLATE back to NONE.
- Some commands (GRAPH, GGRAPH) have a /TEMPLATE subcommand for applying chart templates but this doesn't work properly.
- You can also apply chart templates to existing charts from the menu or (faster) OUTPUT MODIFY.
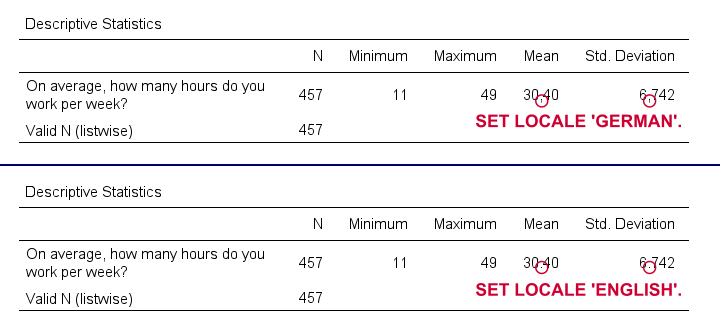
SET LOCALE
In recent SPSS versions, LOCALE is mainly used for specifying which decimal separator to use. It may also affect which character encoding SPSS uses but only if UNICODE = OFF (rarely used anymore).
set locale 'german'.
*Run minimal descriptives table.
descriptives whours.
*Set locale to German (dot as decimal separator).
set locale 'english'.
*Run minimal descriptives table.
descriptives whours.
Result
Quick note: I often prefer to use the DOT and COMMA formats for choosing which decimal separator is used. Doing so also makes converting string to numeric variables independent of your settings as discussed in SPSS Convert String to Numeric Variable. The syntax below, however, simply replicates the previous example using this alternative method.
formats whours(dot2).
*Run minimal descriptives table.
descriptives whours.
*Set format whours to comma (dot as decimal separator).
formats whours (comma2).
*Run minimal descriptives table.
descriptives whours.
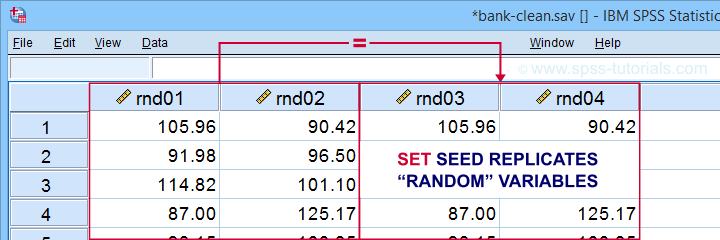
SET SEED - Random Seed
Setting a random seed allows you to exactly replicate anything random in SPSS: computing random variables or drawing random samples. The example below computes two normally distributed random variables and then exactly replicates both.
set seed 1.
*Compute two "random" variables.
compute rnd01 = rv.normal(100,15).
compute rnd02 = rv.normal(100,15).
execute.
*Reset random seed to 1 (assuming RNG = MC).
set seed 1.
*Replicate previous "random" variables.
compute rnd03 = rv.normal(100,15).
compute rnd04 = rv.normal(100,15).
execute.
Result
Minor note: SET SEED only takes effect if RNG = MC (default). You need to use SET MTINDEX if RNG = MT but I don't think anybody ever uses that.
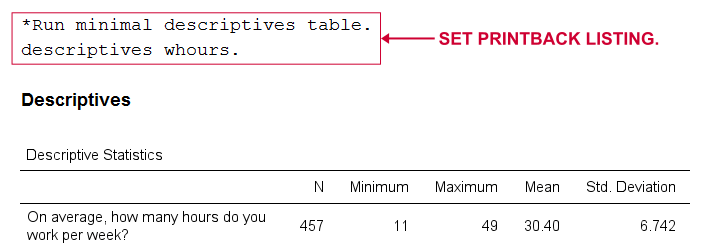
SET PRINTBACK
PRINTBACK tells SPSS whether to print the syntax you run (either from a syntax window or the menu) into your output window. Doing so may come in handy if you export all output to a single .pdf or WORD file.
set printback listing.
*Run minimal descriptives table.
descriptives whours.
*Don't print syntax into output viewer.
set printback none.
*Run minimal descriptives table.
descriptives whours.
Result
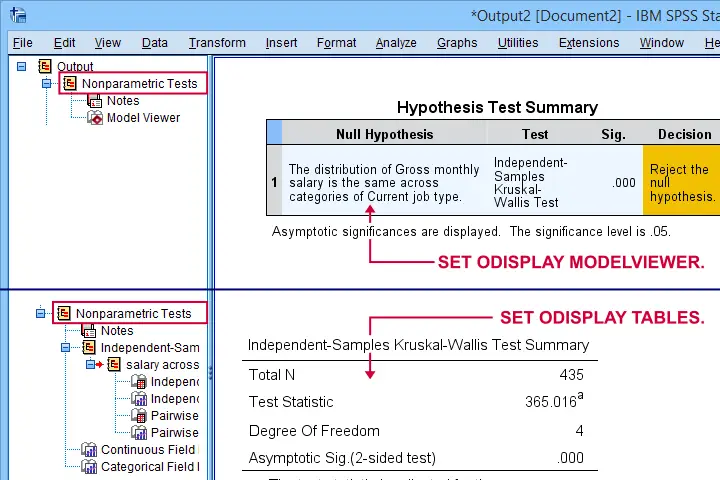
SET ODISPLAY - Output Display
For GENLINMIXED and NPTESTS, two output formats are available:
- the dreadful “model viewer” object or
- normal output (pivot) tables.
The syntax below creates both formats for a basic Kruskal-Wallis test.
set odisplay modelviewer.
*Kruskal-Wallis test.
NPTESTS
/INDEPENDENT TEST (salary) GROUP (jtype) KRUSKAL_WALLIS(COMPARE=PAIRWISE)
/MISSING SCOPE=ANALYSIS USERMISSING=EXCLUDE
/CRITERIA ALPHA=0.05 CILEVEL=95.
*Create pivot tables for NPTESTS (recommended).
set odisplay tables.
*Kruskal-Wallis test.
NPTESTS
/INDEPENDENT TEST (salary) GROUP (jtype) KRUSKAL_WALLIS(COMPARE=PAIRWISE)
/MISSING SCOPE=ANALYSIS USERMISSING=EXCLUDE
/CRITERIA ALPHA=0.05 CILEVEL=95.
Result
Note: I usually prefer a completely different command for the Kruskal-Wallis test as discussed in How to Run a Kruskal-Wallis Test in SPSS? This method does not include pairwise comparisons but I'm not a big fan of those anyway.
Related Commands - SHOW, PRESERVE & RESTORE
Before closing off, I should point out that you can use SHOW for looking up settings. Like so, SHOW ALL. shows all settings. These include some that you can't set with SET and some that you can't change at all.
Last but not least, you can undo changes in settings by preceding SET with PRESERVE and succeeding it with RESTORE. I find these commands mostly useful for building SPSS tools that change somebody else’s settings.
Right, I hope you found this tutorial helpful. Let me know if you (dis)agree and/or if I missed anything by throwing a quick comment below. Other than that:
Thanks for reading!
THIS TUTORIAL HAS 6 COMMENTS:
By Jon Peck on April 7th, 2026
Some other suggestions:
Change Data > Transformation and Merge Options to "Calculate Values before Used". This saves unnecessary data passes.
Consider the choices under General > Variable Lists. The best order option will depend on the nature of the data and familiarity with the dataset, so changing it according to the test can make life easier.
The Viewer options set what types of output items are shown by default, which can help to get the output looking the way you want it.
And, for syntax users, the Utilities > Define Variable Macro can be a big time save when working with data having many variables (while avoiding the need to use the macro language directly).