SPSS doesn't offer an easy way to set decimal places for output tables. This tutorial proposes a very simple tool for setting decimal places in basic output tables after they've been produced. It works best for simple tables such as DESCRIPTIVES, MEANS or CROSSTABS.
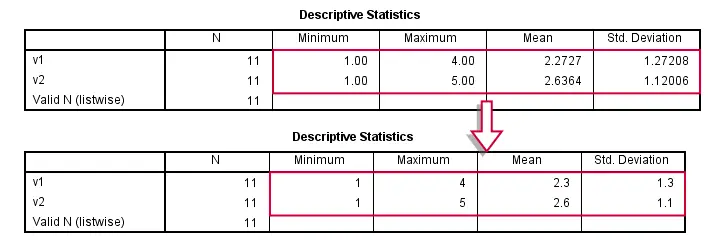
Setting Decimal Places for Output Tables
- First, make sure that the SPSS Python Essentials are installed and run properly.
- Download and double click the SPSS Output Decimals Tool to install it. Note that this is an SPSS custom dialog.
- Run one or more tables, for example with DESCRIPTIVES, MEANS or CROSSTABS. Select one or more of them in the output viewer window.
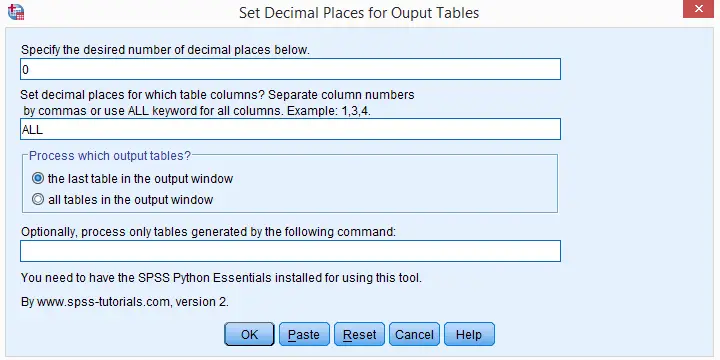
- Go to
 .
. - Choose which columns you'd like to process for all selected tables and the desired number of decimal places.
- Click or and run the syntax.
- Different decimal places for different columns can be set by running the tool repeatedly over the same tables, specifying different columns and decimal places in each run.The syntax example shows how to do this fast.
Specifying Columns
The diagram below illustrates how to specify columns. Note that the first “columns” don't count; according to SPSS pivot table terminology, these are not columns but row labels.This distinction is important for SPSS table templates (.stt files) as well as the Python scripting used by the tool.
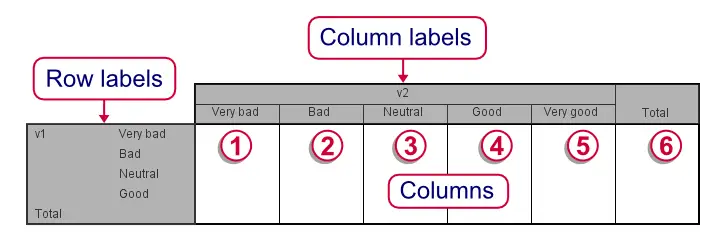
Note that row and column labels are never affected by the Output Decimals tool. Although the diagram shows value labels (“Very bad” and so on) here instead of values, this is not always the case. If values are shown, then decimal places for row and column labels can easily be set by FORMATS.
SPSS Decimal Places in Output - Alternatives
- Since Python was introduced in SPSS version 14, Python scripting is the way to go for setting decimal places for output tables. The level of control it offers is basically unlimited but most users may find Python scripts hard to write and they require a lot of syntax. The output decimals tool uses Python scripting under the hood.
- The classical approach to setting decimal places for output tables is an SPSS script. Note that SPSS scripts (.sbs files) are very different from SPSS syntax (.sps) files. SPSS scripts are considered deprecated since Python scripting was introduced as its successor in SPSS version 14.
- SPSS OUTPUT MODIFY can be used for modifying basically anything about SPSS output tables including decimal places and text styles. Due to its complexity, however, we find it rather hard to get things done with it. Personally, we strongly prefer simpler tools even if they offer less functionality.
SPSS Python Syntax Example
Instead of using the Custom Dialog we just discussed, you may click here for an SPSS Python syntax version of this tool, including some basic tests for our tool.
data list free/id.
begin data
0 0 0 0 0 0 0 0 0 0 0
end data.
do repeat v = v1 to v5.
compute v = rv.binom(5,.5).
end repeat.
************20. GENERATE SOME TABLES.
descriptives v1 v2.
means v1 by v2.
crosstabs v1 by v2/cells column.
************30. DEFINE FUNCTION.
begin program.
def setOutputDecimals(cols,decs):
import SpssClient
SpssClient.StartClient()
outputDoc = SpssClient.GetDesignatedOutputDoc()
outputItems = outputDoc.GetOutputItems()
for index in range(outputItems.Size()):
outputItem = outputItems.GetItemAt(index)
if outputItem.GetType() == SpssClient.OutputItemType.PIVOT and outputItem.IsSelected():
pTable = outputItem.GetSpecificType()
dataCells = pTable.DataCellArray()
for row in range(dataCells.GetNumRows()):
if cols.lower() != 'all':
try:
colList = [int(col) - 1 for col in cols.split(',')] #Because indexed at 0
except:
print "Invalid column specification. Please specify positive integers separated by commas or the 'ALL' keyword."
break
else:
colList = range(dataCells.GetNumColumns())
for col in colList:
try:
dataCells.SetHDecDigitsAt(row,col,decs)
except:
pass
SpssClient.StopClient()
end program.
************40. TEST: SELECT (ONLY) DESCRIPTIVES TABLE IN OUTPUT AND RUN.
begin program.
setOutputDecimals('2,3',0)
setOutputDecimals('4',1)
setOutputDecimals('5',2)
end program.
************50. TEST: SELECT (ONLY) MEANS TABLE IN OUTPUT AND RUN.
begin program.
setOutputDecimals('1',1)
setOutputDecimals('3',2)
end program.
************60. TEST: SELECT (ONLY) CROSSTAB IN OUTPUT AND RUN.
begin program.
setOutputDecimals('all',0)
end program.
THIS TUTORIAL HAS 23 COMMENTS:
By Ruben Geert van den Berg on April 26th, 2016
Hi Yaser!
I had the same problem and it's been reported a couple of times before. I think it's just a bug in SPSS.
However, I never had this problem with the toolbars I created myself - which are all I really want anyway. So I never bothered to try and restore the default toolbars.
I that doesn't work for you, try Googling the issue. I'm sure some forum posts will come up but I don't know whether anybody resolved the issue thus far.
By Yaser Pourdavar on April 26th, 2016
Hi Ruben.
I think I found the answer on the web. Now I see the toolbars.
The problem is related to registry.
I followed the instructions stated in a web page and it solved my problem so I'll send the link to be used by others.
Thanks
By Ruben Geert van den Berg on April 26th, 2016
Hi Yaser!
Happy to hear it's been fixed. Indeed, I remember it seemed related to the Windows' registry. It's usually recommended you don't edit your registry unless you really know what you're doing because Windows may stop working otherwise. I hope your fix wasn't that difficult to apply!
By Yaser Pourdavar on April 30th, 2016
Hi Ruben
I went to the link below:
http://www-01.ibm.com/support/docview.wss?uid=swg21640411
It says about the "Cause and Resolving the problem
By Cindy on August 25th, 2016
I'm using SPSS 22, and the SPSS Python Essentials are installed and run properly. I followed the instruction to set decimal places for output tables. I found that the function of 'set decimal places for output tables' can only apply to the first two frequency tables that I selected. Yet, I need to set the decimal places for more than two tables. How can I fix the problem?