A dichotomous variable is a variable that contains precisely two distinct values. Let's first take a look at some examples for illustrating this point. Next, we'll point out why distinguishing dichotomous from other variables makes it easier to analyze your data and choose the appropriate statistical test.
Examples
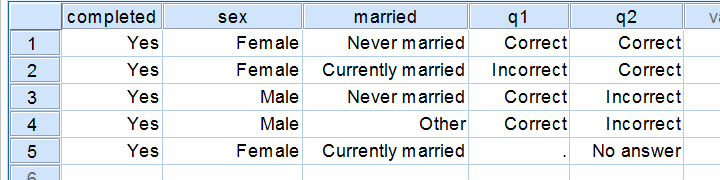
Regarding the data in the screenshot:
- completed is not a dichotomous variable. It contains only one distinct value and we therefore call it a constant rather than a variable.
- sex is a dichotomous variable as it contains precisely 2 distinct values.
- married is not a dichotomous variable: it contains 3 distinct values. It would be dichotomous if we just distinguished between currently married and currently unmarried.
- q1 is a dichotomous variable: since empty cells (missing values) are always excluded from analyses, we have two distinct values left.
- q2 is a dichotomous variable if we exclude the “no answer” category from analysis and not dichotomous otherwise.
Dichotomous Variables - What Makes them Special?
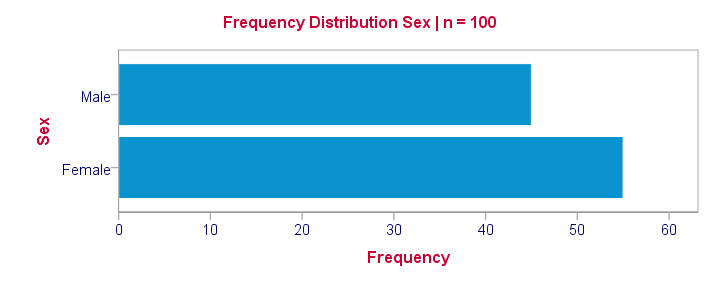
Dichotomous are the simplest possible variables. The point here is that -given the sample size- the frequency distribution of a dichotomous variable can be exactly described with a single number: if we've 100 observations on sex and 45% is male, then we know all there is to know about this variable.
Note that this doesn't hold for other categorical variables: if we know that 45% of our sample (n = 100) has brown eyes, then we don't know the percentages of blue eyes, green eyes and so forth. That is, we can't describe the exact frequency distribution with one single number.
Something similar holds for metric variables: if we know the average age of our sample (n = 100) is precisely 25 years old, then we don't know the variance, skewness, kurtosis and so on needed for drawing a histogram.
Dichotomous Variables are both Categorical and Metric
Choosing the right data analysis techniques becomes much easier if we're aware of the measurement levels of the variables involved. The usual classification involves categorical (nominal, ordinal) and metric (interval, ratio) variables. Dichotomous variables, however, don't fit into this scheme because they're both categorical and metric.
This odd feature (which we'll illustrate in a minute) also justifies treating dichotomous variables as a separate measurement level.
Dichotomous Outcome Variables
Some research questions involve dichotomous dependent (outcome) variables. If so, we use proportions or percentages as descriptive statistics for summarizing such variables. For instance, people may or may consider buying a new car in 2017. We might want to know the percentage of people who do. This question is answered with either a binomial test or a z-test for one proportion.
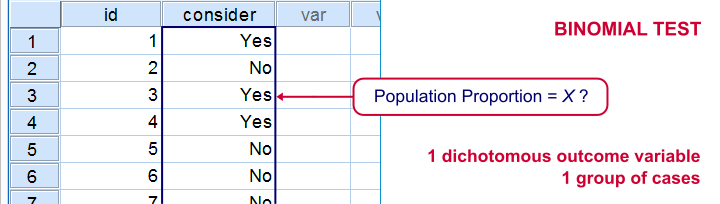
The aforementioned tests -and some others- are used exclusively for dichotomous dependent variables. They are among the most widely used (and simplest) stasticical tests around.
Dichotomous Input Variables
An example of a test using a dichotomous independent (input) variable is the independent samples t-test, illustrated below.
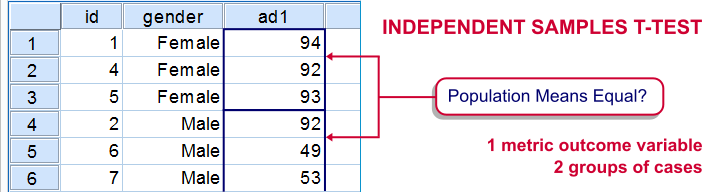
In this test, the dichotomous variable defines groups of cases and hence is used as a categorical variable. Strictly, the independent-samples t-test is redundant because it's equivalent to a one-way ANOVA. However, the independent variable holding only 2 distinct values greatly simplifies the calculations involved. This is why this test is treated separately from the more general ANOVA in most text books.
Those familiar with regression may know that the predictors (or independent variables) must be metric or dichotomous. In order to include a categorical predictor, it must be converted to a number of dichotomous variables, commonly referred to as dummy variables.
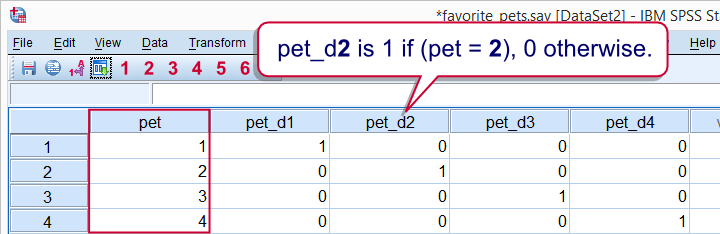
This illustrates that in regression, dichotomous variables are treated as metric rather than categorical variables.
Dichotomizing Variables
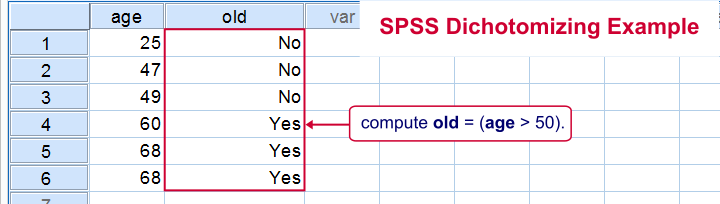
Last but not least, a distinction is sometimes made between naturally dichotomous variables and unnaturally dichotomous variables. A variable is naturally dichotomous if precisely 2 values occur in nature (sex, being married or being alive). If a variable holds precisely 2 values in your data but possibly more in the real world, it's unnaturally dichotomous.
Creating unnaturally dichotomous variables from non dichotomous variables is known as dichotomizing. The final screenshot illustrates a handy but little known trick for doing so in SPSS.
I hope you found this tutorial helpful. Thanks for reading!
THIS TUTORIAL HAS 15 COMMENTS:
By Kadir abdo on November 30th, 2021
Thank you!
How I can do dichotomy with disclosure status and associative factors?
By Ruben Geert van den Berg on November 30th, 2021
Hi Kadir!
For some nice examples of dichotomizing variables in SPSS, look up SPSS FILTER - Quick & Simple Tutorial.
Hope that helps!
SPSS tutorials
By John Lariu Labininay on December 30th, 2022
I'd like to ask. Per say I'm conducting a study and there is 9 item questionnaire with yes or no options whose results would then assess the knowledge of the chosen sample in a particular discipline? How would I analyze this part of the data collected?
By Ruben Geert van den Berg on December 31st, 2022
Hi John!
My approach is to use 0 - 100 (not 0 - 1) coding for such variables and then set their formats to PCT.
Now you can create a table or chart of their means, which will be the percentages of people who said "yes".
Sort this table/charts descendingly and you've a nice overview which questions were answered correctly most often.
You could add a Cochran Q test for testing if all population proportions are equal.
This is basically a repeated measures ANOVA for dichotomous items.
Hope that helps!
By Abubakar hassan Muhammad on July 16th, 2023
The three dichotomous variables are summed up. Then 1 is coded for a sample bank whose forensic index score is greater than 1 or equal to 2
Pls I need this article that has this thank you