SPSS DESCRIPTIVES – Quick Tutorial
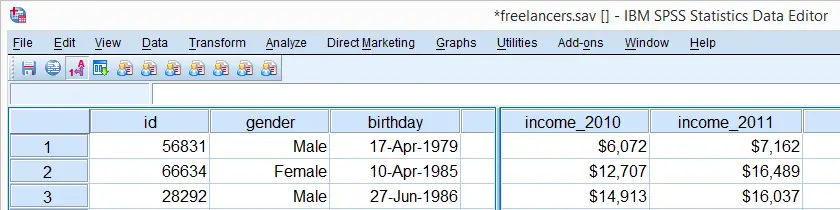
SPSS DESCRIPTIVES generates a single table with descriptive statistics for one or more variables. It can also add z-scores to your data. We'll walk through its major options using freelancers.sav. The screenshot below shows part of its data view.
User Missing Values
Before running any descriptives, we first need to specify some user missing values for income_2010 through income_2014. We'll do so by running the syntax below. The FORMATS command suppresses excessive decimal places for output tables that we'll generate later on.
missing values income_2010 to income_2014 (1000000 thru hi).
*Hide decimal places for income_2010 through income_2014.
formats income_2010 to income_2014 (dollar8).
SPSS DESCRIPTIVES - Basic Use
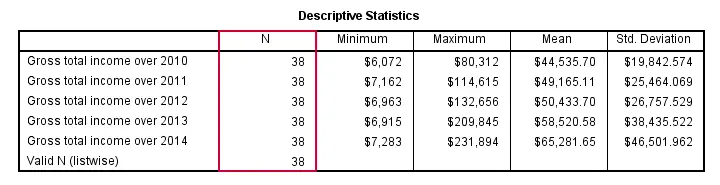
The most basic way to run a descriptives table is simply “DESCRIPTIVES” followed by one ore more variable names (possibly using TO or ALL) and a period. The syntax below gives an example.
descriptives income_2010 to income_2014.
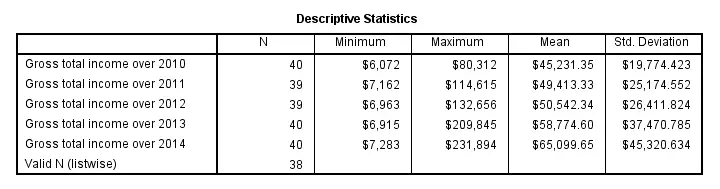
Note that “Valid N (listwise)” denotes the number of cases that don't have any missing values on any of the variables shown in the table.
SPSS DESCRIPTIVES - STATISTICS Subcommand
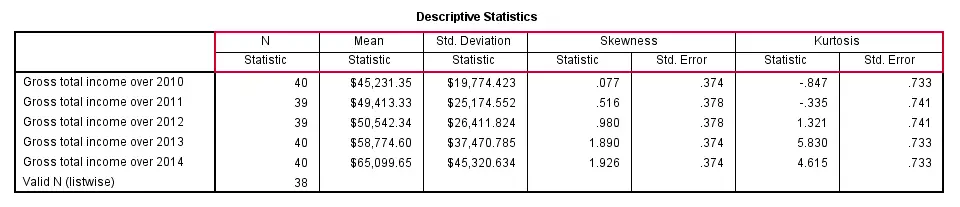
Statistics and the order in which they'll appear in the table can be specified by adding a STATISTICS subcommand. However, the first column for descriptives is always N, even if not specified.
Note that some statistics (such as skewness and kurtosis) will always be followed by their standard error, which can't be specified separately.If this is not to your liking, try MEANS instead. Note that for MEANS, statistics are specified on a CELLS subcommand; STATISTICS refers to test statistics for significance tests here.
descriptives income_2010 to income_2014
/statistics mean stddev skewness kurtosis.
SPSS DESCRIPTIVES - SORT Subcommand
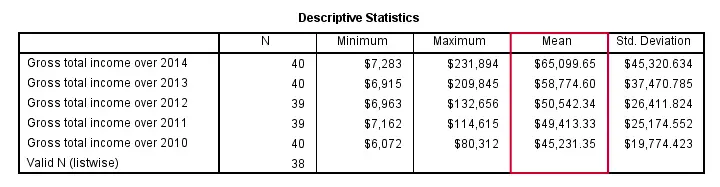
By default, table rows (representing variables) are sorted by the order in which these variables are specified in DESCRIPTIVES. This can be changed by specifying a statistic (or NAME for variable names) on a SORT subcommand. Add “(d)” for sorting descendingly.
descriptives income_2010 to income_2014
/sort mean(d).
SPSS DESCRIPTIVES - MISSING Subcommand
By default, DESCRIPTIVES uses pairwise deletion of missing values: for each variable, all cases having a valid value on this variable are used.Since “deletion” doesn't actually delete anything, “exclusion” would be more appropriate here. This is why N may differ for different variables.
Specifying LISTWISE on a MISSING subcommand implies listwise deletion of missing values: for all variables, only cases are used that don't have any missing value on any of these variables.
descriptives income_2010 to income_2014
/missing listwise.
SPSS DESCRIPTIVES - Z-Scores
Standardizing variables mean rescaling them so that they have a mean of 0 and a standard deviation of 1. This is done by subtracting a variable's mean from each separate value and dividing the remainder by the variable's standard deviation. The resulting values are called z-scores.
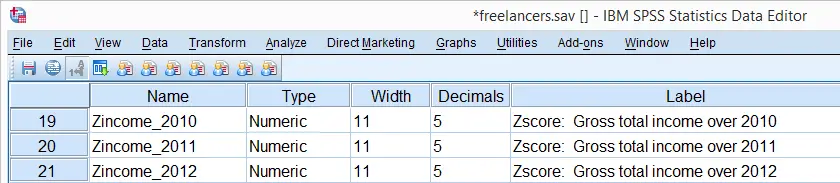
DESCRIPTIVES offers two ways for adding z-scores to your data. First, adding a SAVE subcommand standardizes all variables on the DESCRIPTIVES command. The names for these new variables are the original variable names prefixed by “Z”. The screenshot below shows the result in data view.
descriptives income_2010 to income_2014
/save.
A second option here is adding variable names for the new (standardized) variables behind the original variable names, enclosed by parentheses.
descriptives income_2012 (z2) income_2013 (z3).
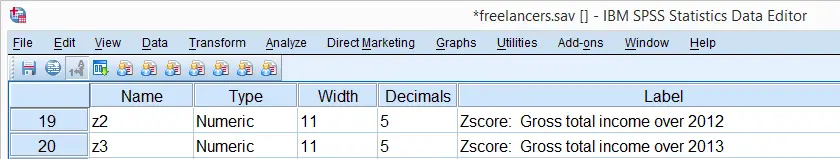
Note that either option for standardizing variables leaves the original variables intact. Second, DESCRIPTIVES automatically adds variable labels to the newly added standardized variables.
Z-Scores - Cautionary Note
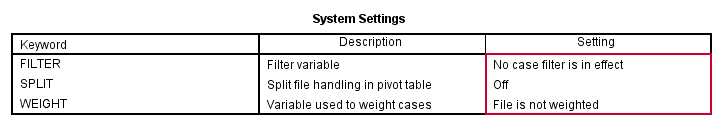
Whenever adding z-scores to your data with DESCRIPTIVES, keep in mind that the result may be affected by the missing subcommand. Also, FILTER, SPLIT FILE or WEIGHT being in effect may influence the calculation of z-scores. This may or may not be your intention.
Recent SPSS versions will show in the status bar whether these are in effect. However, if you want to be really sure, simply run
show filter split weight.
just before standardizing variables to stay on the safe side.
SPSS FREQUENCIES – Quick Tutorial
SPSS FREQUENCIES command can be used for much more than frequency tables: it's also the easiest way to obtain basic charts such as histograms and bar charts. On top of that, it provides us with percentiles and some other statistics. Plenty of reasons for taking a closer look at this ubiquitous SPSS command. We'll use employees.sav throughout this tutorial.
SPSS FREQUENCIES - Basic Table
The most basic way to use FREQUENCIES is simply generating a frequency table. For example, the frequency table for job_type is obtained by running the following line of SPSS syntax: frequencies job_type.
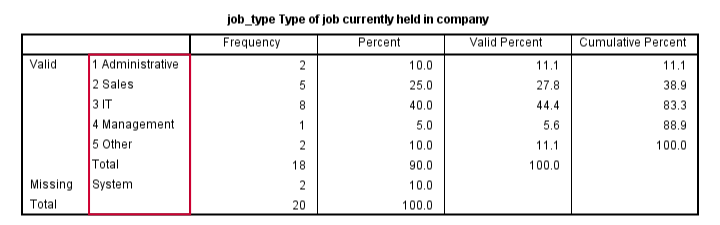
By default, the rows of this table are sorted ascendingly by value. Note that this may not be obvious when only value labels are displayed. We'll next take a look at different options for sorting the table rows.
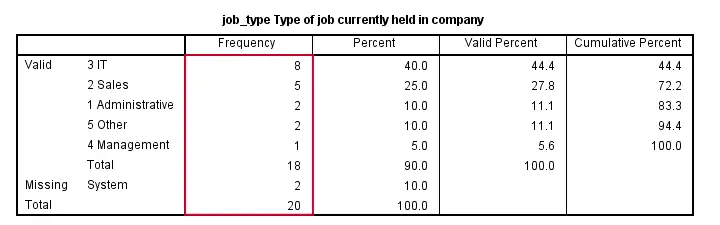
SPSS FREQUENCIES - Sort Order
SPSS default sort order of ascendingly be value can be changed by adding a FORMAT subcommand. Possible values are AVALUE and DVALUE (ascending and descending values) or AFREQ and DFREQ (ascending and descending frequencies). For example, the syntax below sorts the rows from the value with highest frequency (yes, that's the mode) through the value with the lowest frequency.
frequencies job_type
/format dfreq.
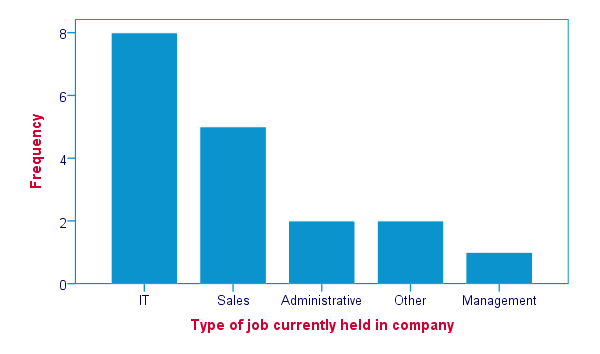
SPSS FREQUENCIES - Bar Chart
SPSS FREQUENCIES command is the easiest way to create one or more bar charts for categorical variables. Just add the BARCHART subcommand. Note that you can combine it with a sort order, resulting in the barchart bars being ordered from highest through lowest frequency as shown below.
frequencies job_type
/format dfreq
/barchart.
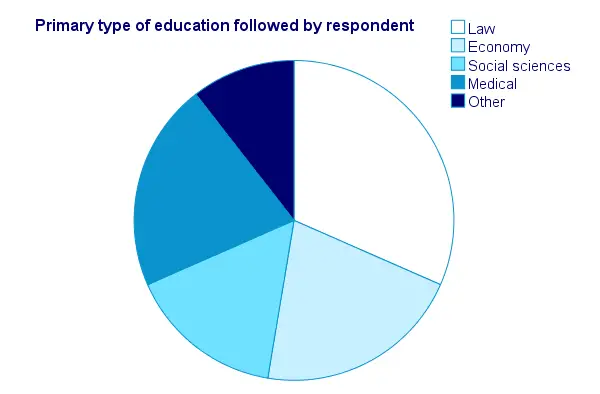
SPSS FREQUENCIES - Pie Chart
An alternative visualization for categorical variables is a pie chart. In order to generate it, simply add a PIECHART subcommand to FREQUENCIES. The syntax below creates a pie chart for education_type.
frequencies education_type
/piechart.
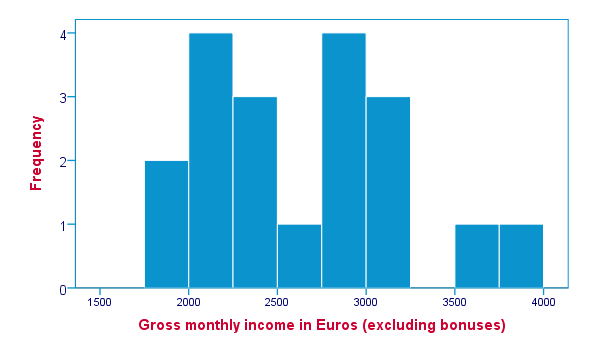
SPSS FREQUENCIES - Histogram
Frequency tables, bar charts and pie charts can all be used for both metric as well as categorical variables, including string variables. However, they are not useful for metric variables with many distinct values; in this case, tables get too many rows and graphs too many elements.
The ideal way to visualize such variables is a histogram, obtained by the HISTOGRAM subcommand. Apart from that, we can suppress frequency tables by specifying NOTABLE on the FORMAT subcommand. Like so, the syntax below generates a histogram for monthly_income.
frequencies monthly_income
/format notable
/histogram.
SPSS FREQUENCIES - Percentiles
SPSS FREQUENCIES provides a nice way to obtain percentiles: just add a PERCENTILES subcommand followed by the desired percentiles in parentheses. The syntax below gives an example. Keep in mind that percentiles are not meaningful for nominal variables.
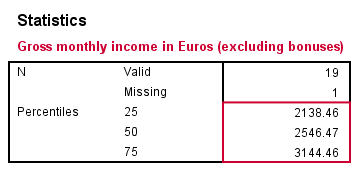
frequencies monthly_income
/format notable
/percentiles (25 50,75).
SPSS FREQUENCIES - Ntiles
Ntiles are easily obtained with SPSS FREQUENCIES: simply add the NTILES subcommand with the number of ntiles behind it in parentheses. If you want to assign cases to ntile groups, use RANK; it creates a new variable holding the ntile for each case on a given variable. Both options are shown in the syntax below.
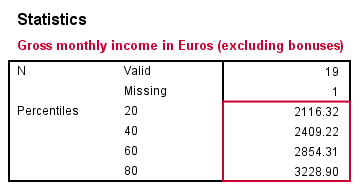
frequencies monthly_income
/format notable
/ntiles (5).
*2. Create monthly_income ntile group variable in data.
rank monthly_income/ntiles(5).
SPSS FREQUENCIES - Statistics
SPSS FREQUENCIES can compute all statistics obtained from DESCRIPTIVES plus the median and mode. Note that the statistics table from FREQUENCIES has a different layout with variables in columns and statistics in rows. For obtaining them, add a STATISTICS subcommand. Just as with DESCRIPTIVES, specifying the ALL keyword returns all available statistics.
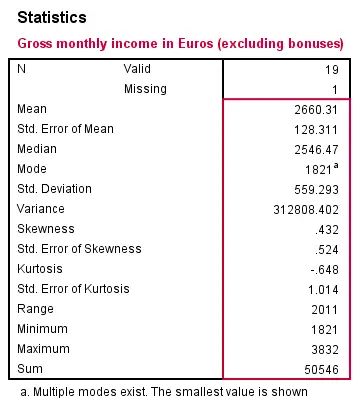
frequencies monthly_income
/format notable
/statistics all.
SPSS FREQUENCIES - Multiple Variables
Obviously, FREQUENCIES can be run for multiple variables, possibly using TO or ALL. If multiple types of output (frequency table, chart and so on) are generated, you can have them sorted by variable or output type by specifying VARIABLE or ANALYSIS on an ORDER subcommand.
frequencies education_type to job_type
/format dfreq
/barchart
/order variable.
*2. Sort output by output type (first tables for all variables, then charts for all variables).
frequencies education_type to job_type
/format dfreq
/barchart
/order analysis.