SPSS – Missing Values for String Variables
- Setting Missing Values for String Variables
- Missing String Values and MEANS
- Missing String Values and CROSSTABS
- Missing String Values and COMPUTE
- Workarounds for Bugs
Can you set missing values for string variables in SPSS? Short answer: yes. Sadly, however, this doesn't work as it should. This tutorial walks you through some problems and fixes.
Example Data
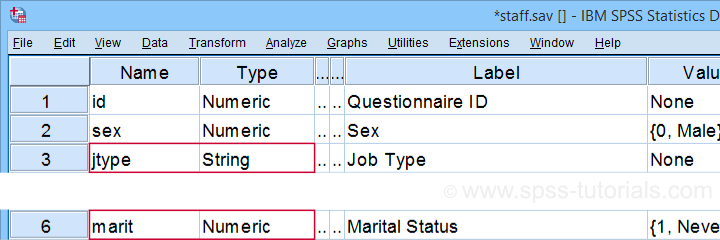
All examples in this tutorial use staff.sav, partly shown below. We'll run some basic operations on Job Type (a string variable) and Marital Status (a numeric variable) in parallel.
Let's first create basic some frequency distributions for both variables by running the syntax below.
frequencies marit jtype.
Result
Let's take a quick look at the frequency distribution for our string variable shown below.
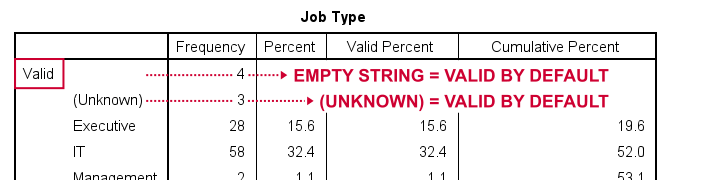
By default, all values in a string variable are valid (not missing), including an empty string value of zero characters.
Setting Missing Values for String Variables
Now, let's suppose we'd like to set the empty string value and (Unknown) as user missing values. Experienced SPSS users may think that running missing values jtype ('','(Unknown)'). should do the job. Sadly, SPSS simply responds with a rather puzzling warning:
>The missing value is specified more than once.
First off, this warning is nonsensical: we didn't specify any missing value more than once. And even if we did. So what?
Second, the warning doesn't tell us the real problem. We'll find it out if we run
missing values jtype ('(Unknown)').
This triggers the warning below, which tells us that our user missing string value is simply too long.
>The missing value exceeds 8 bytes.
>Execution of this command stops.
A quick workaround for this problem is to simply RECODE '(Unknown)' into something shorter such as 'NA' (short for ‘Not Available”). The syntax below does just that. It then sets user missing values for Job Type and reruns the frequency tables.
recode jtype ('(Unknown)' = 'NA').
*Set 2 user missing values for string variable.
missing values jtype ('','NA').
*Quick check.
frequencies marit jtype.
Result
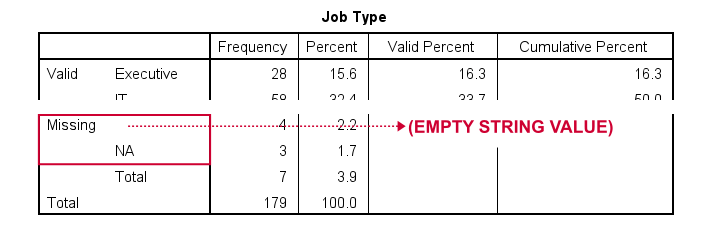
At this point, everything seems fine: both the empty string value and 'NA' are listed in the missing values section in our frequency table.
Missing String Values and MEANS
When running basic MEANS tables, user missing string values are treated as if they were valid. The syntax below demonstrates the problem:
means salary by marit jtype
/statistics anova.
Result
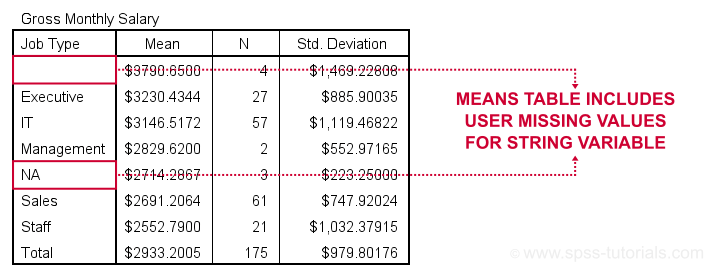
Note that user missing values are excluded in the first means table but included in the second means table. As this doesn't make sense and is not documented, I strongly suspect that this is a bug in SPSS.
Let's now try some CROSSTABS.
Missing String Values and CROSSTABS
We'll now run two basic contingency tables from the syntax below.
crosstabs marit jtype by sex.
Result
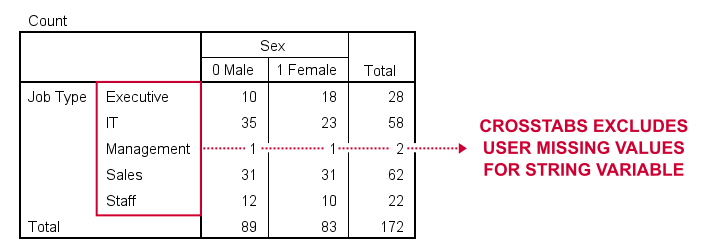
Basic conclusion: both tables fully exclude user missing values for our string and our numeric variables. This suggests that the aforementioned issue is restricted to MEANS. Unfortunately, however, there's more trouble...
Missing String Values and COMPUTE
A nice way to dichotomize variables is a single line COMPUTE as in
compute marr = (marit = 2).
In this syntax, (marit = 2) is a condition that may be false for some cases and true for others. SPSS returns 0 and 1 to represent false and true and hence creates a nice dummy variable.
Now, if marit is (system or user) missing, SPSS doesn't know if the condition is true and hence returns a system missing value on our new variable. Sadly, this doesn't work for string variables as demonstrated below.
compute marr = (marit = 2).
variable labels marr 'Currently married (yes/no)'.
frequencies marr.
*Dichotomize string variable (incorrect result).
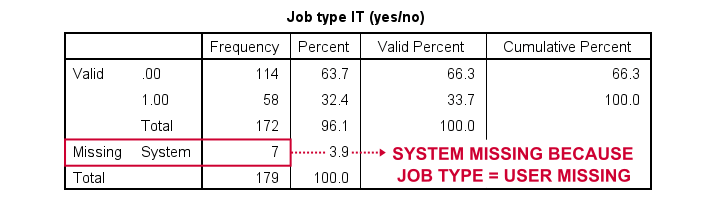
compute it = (jtype = 'IT').
variable labels it 'Job type IT (yes/no)'.
frequencies it.
A workaround for this problem is using IF. This shouldn't be necessary but it does circumvent the problem.
delete variables it.
*Dichotomize string variable (correct result).
if(not missing(jtype)) it = (jtype = 'IT').
variable labels it 'Job type IT (yes/no)'.
frequencies it.
Result
Workarounds for Bugs
The issues discussed in this tutorial are nasty; they may produce incorrect results that easily go unnoticed. A couple of ways to deal with them are the following:
- AUTORECODE string variables into numeric ones and proceed with these numeric counterparts.
- for creating tables and/or charts, exclude cases having string missing values with FILTER or even delete them altogether with SELECT IF.
- for creating new variables, IF and DO IF should suffice for most scenarios.
Right, I guess that should do regarding user missing string values. I hope you found my tutorial helpful. If you've any questions or comments, please throw us a comment below.
Thanks for reading!
SPSS – Combining Data with Syntax and Output
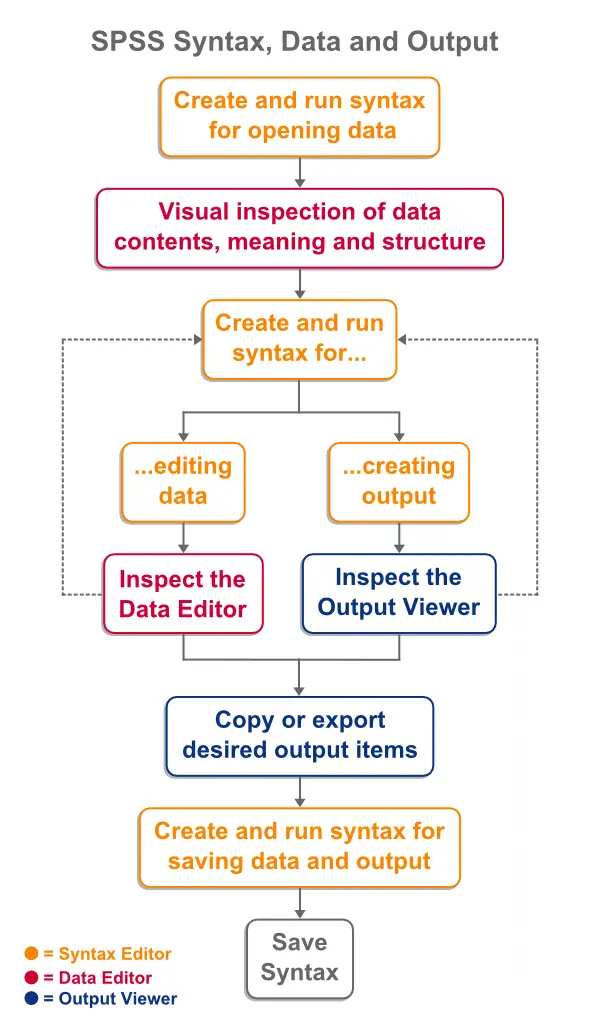
The previous tutorials explored SPSS' three main windows. These are
- SPSS Data Editor window
 ;
; - SPSS syntax editor window
 ;
; - SPSS output viewer window
 .
.
Now that we have a basic understanding of what they're for, let's take a look at the big picture: the figure below proposes a typical flowchart for proceeding through a research project, switching between the Syntax Editor, Data Editor and Output viewer windows.
SPSS - Keeping Your Work Organized
How people organize their project work is a rather personal matter. However, we'd like to share how we typically keep our SPSS data, syntax and output files organized in a single folder. Let's first take a careful look at the screenshot below and then we'll walk through some main points.
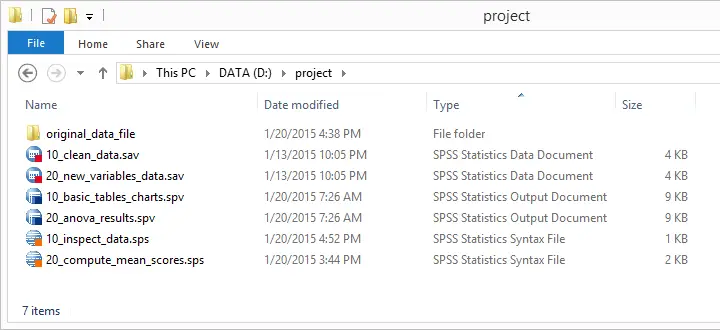
- First, try and keep all SPSS files in a single folder. Like so, you can nicely shorten some syntax by running a CD command.
- Make sure that regular backup copies of the entire project folder are made, especially if it's located on a local hard disk.
- Never edit your original data file. In order to keep it apart from the other files, we suggest putting it in its own subfolder. You can further protect it by saving it as a read-only file.
- Number your syntax, data and output files in the order in which they occur in the project. Put the number in front of the filename so that sorting files according to file name corresponds to their chronological order.
- Using tenfolds for numbering (10, 20, 30...) allows you to insert files without breaking their order. For example, you can prefix a syntax file with 15 to indicate it should be run between the syntax files prefixed with 10 and 20.
- Try to use descriptive file names that provide at least a good clue of what's in there.
Final Note
Admittedly, keeping your work organized will cost you some time and effort. However, not keeping your work organized will eventually cost you much more time and effort. We really hope you don't have to learn this the hard way.