- Example Data File
- Kendall’s Tau-B from Correlations Menu
- Kendall’s Tau-B & Tau-C from Crosstabs
- Wrong Significance Levels for Small Samples
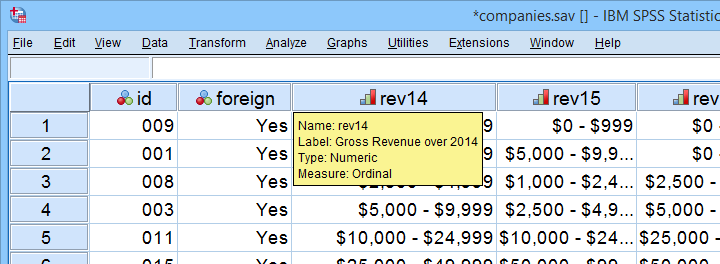
Example Data File
A survey among company owners included the question “what was your yearly revenue?” for several years. The data -partly shown below- are in companies.sav.
Our main research question for today is
to what extent are yearly revenues interrelated?
Are the best performing companies in 2014 the same as in 2015 and other years? Or do we have entirely different “winners” from year to year?
If we had the exact yearly revenues, we could have gone for Pearson correlation among years and perhaps proceed with some regression analyses.
However, our data contain only revenue categories and these are ordinal variables. This leaves us with 2 options: we can inspect either
Although both statistics are appropriate, we'll go for Kendall’s tau: its standard error and sampling distribution are better known and the latter converges to a normal distribution faster.
Filtering Out Domestic Companies.
We'll restrict our analyses to foreign companies by using a FILTER. Since this variable only contains 1 (foreign) and 0 (domestic), a single line of syntax is all we need.
filter by foreign.
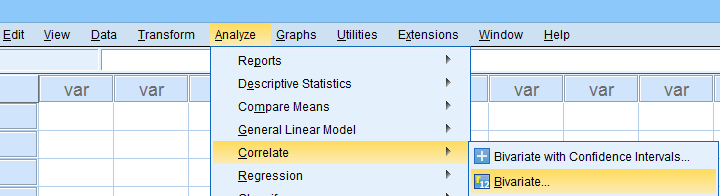
Kendall’s Tau-B from Correlations Menu
The easiest option for Kendalls tau-b is the correlations menu as shown below.
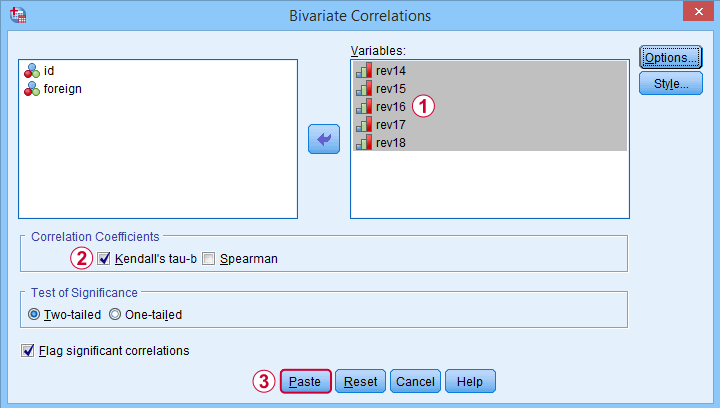
 Move all relevant variables into the variables box,
 select Kendall’s tau-b and
 clicking results in the syntax below. Let's run it.
NONPAR CORR
/VARIABLES=rev14 rev15 rev16 rev17 rev18
/PRINT=KENDALL TWOTAIL NOSIG
/MISSING=PAIRWISE.
*Short syntax, identical results.
nonpar corr rev14 to rev18
/print kendall nosig.
Result
SPSS creates a full correlation matrix, part of which is shown below.
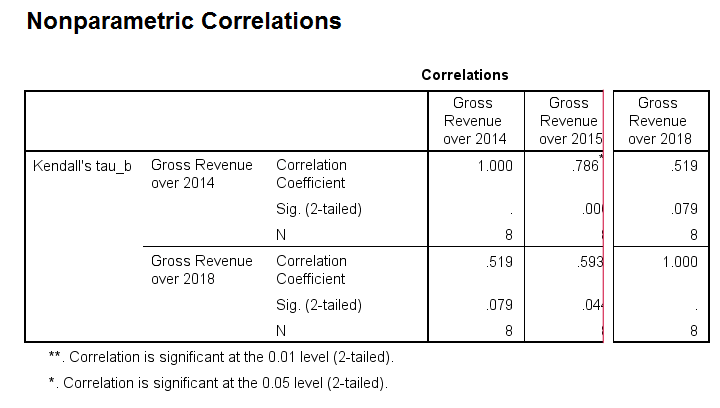
Note that most Kendall correlations are (very) high. This means that
companies that perform well in one year
typically perform well in other years too.
Despite our minimal sample size, many Kendall correlations are statistically significant. The p-values are identical to those obtained from rerunning the analysis in JASP.
Kendall’s Tau-B and Tau-C from Crosstabs
An alternative method for obtaining Kendalls tau from SPSS is from CROSSTABS. We only recommend this if
- you're going to run CROSSTABS anyway -probably for obtaining chi-square tests;
- you need Kendall’s tau-c instead of tau-b;
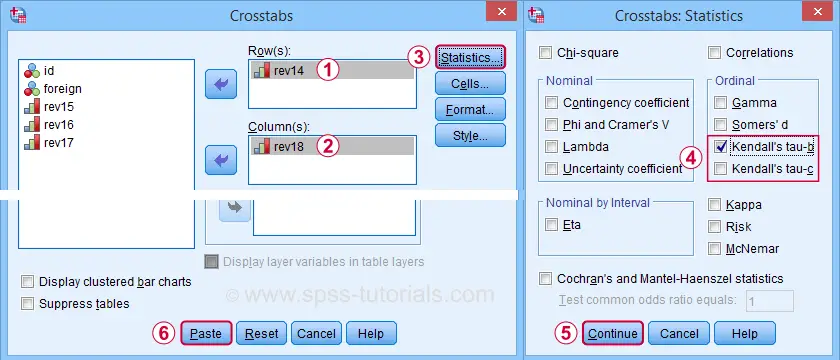
In such cases, you could access the Crosstabs dialog as shown below.
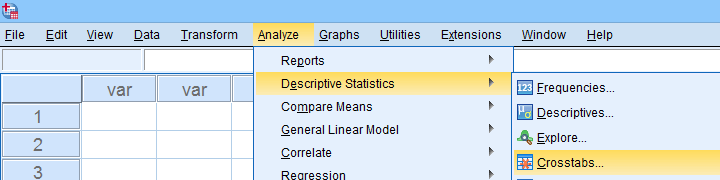
A lot of useful association measures -including Cramér’s V and eta squared- are found under Statistics.
 Select either Kendall’s tau-b and/or tau-c -although the latter is rarely reported.
 Clicking results in the syntax below.
CROSSTABS
/TABLES=rev14 BY rev18
/FORMAT=AVALUE TABLES
/STATISTICS=BTAU
/CELLS=COUNT
/COUNT ROUND CELL.
*Short syntax, identical results.
crosstabs rev14 by rev18
/statistics btau.
Wrong Significance Levels for Small Samples
Although Kendall’s tau obtained from CROSSTABS is correct, some of the other results are awkward at best.
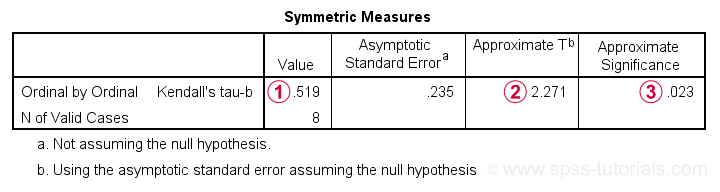
Kendall’s tau-b is identical to that obtained from the correlations dialog;
The Approximate T is a z-value rather than a t-value: it's approximately normally distributed but only for reasonable sample sizes. It cannot be used for the small sample size used in this example.
As a result, the Approximate Significance is wildly off:
SPSS comes up with p = 0.079 for the exact same data
when using the correlations dialog. This is the exact p-value that should be used for small sample sizes.
“Officially”, the approximate significance may be used for N > 10 but perhaps it's better avoided if N < 20 or so. In such cases, it may be wiser to run Kendall’s tau from the Correlations dialog than from Crosstabs.
Thanks for reading.
THIS TUTORIAL HAS 8 COMMENTS:
By Jon Peck on January 28th, 2020
The CROSSTABS sig level is asymptotic, but with the exact option, it should be more accurate than what NONPAR reports.
NONPAR has to store the data in memory while CROSSTABS does not, which is why the latter uses the asymptotic formula.
By Ruben Geert van den Berg on January 28th, 2020
That's interesting! But NONPAR CORR reports the exact significance, right? What could be more accurate than exact?
From the users point of view the difference still looks weird. I think CROSSTABS should at least throw a warning when the sample size is insufficient for the normal approximation. Just spitting out a p-value could mislead less educated users. Now it also seems as if SPSS is unaware that it's reporting a p-value that's wildly off.
By Dr Mehboob Ahmad on October 15th, 2020
Very good
By Jon K Peck on July 25th, 2022
Relying on an asymptotic distribution with only 8 cases would always be dicey. If you run your calculations with all 16 cases - still pretty small, you get .85 vs .89. If you use the exact option in crosstabs, you get .094 for that case.
By Ruben Geert van den Berg on July 26th, 2022
Hi Jon!
Sure, I agree that asymptotic p-values are a bad idea for small sample sizes.
But what I wonder is: why does SPSS even report this?
I believe that most "nonparametric" tests always report exact p-values for small samples (even if one is not licensed for "exact tests"). For instance:
"An exact significance level is computed if there are 40 or fewer cases. For more than 40 cases, U is transformed into a normally distributed Z statistic, and a normal approximation p value is computed."
It would be nice if CROSSTABS would apply the same logic. But anyway, it's a pretty minor point.
P.s. I've an entirely different question as well which I'll send by email. Hope you're willing to take a look at it.
Thanks!