- Open Excel File with Values in SPSS
- Apply Variable Labels from Excel
- Apply Value Labels from Excel
- Open Excel Files with Strings in SPSS
- Converting String Variables from Excel

Excel files containing social sciences data mostly come in 2 basic types:
- files containing data values (1, 2, ...) and variable names (v01, v02, ...) and separate sheets on what the data represents as shown in course-evaluation-values.xlsx;
- files containg answer categories (“Good”, “Bad”, ...) and question descriptions (“How did you find...”) as in course-evaluation-labels.xlsx.
Just opening either file in SPSS is simple. However, preparing the data for analyses may be challenging. This tutorial quickly walks you through.
Open Excel File with Values in SPSS
Let's first fix course-evaluation-values.xlsx, partly shown below.
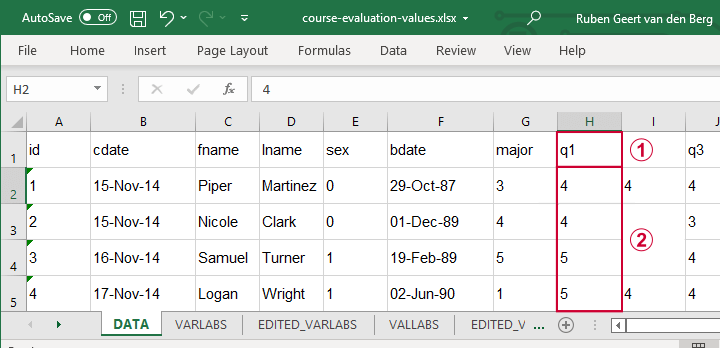
 The data sheet has short variable names whose descriptions are in another sheet, VARLABS (short for “variable labels”);
 Answer categories are represented by numbers whose descriptions are in VALLABS (short for “value labels”).
Let's first simply open our actual data sheet in SPSS by navigating to as shown below.

Next up, fill out the dialogs as shown below. Tip: you can also open these dialogs if you drag & drop an Excel file into an SPSS Data Editor window.
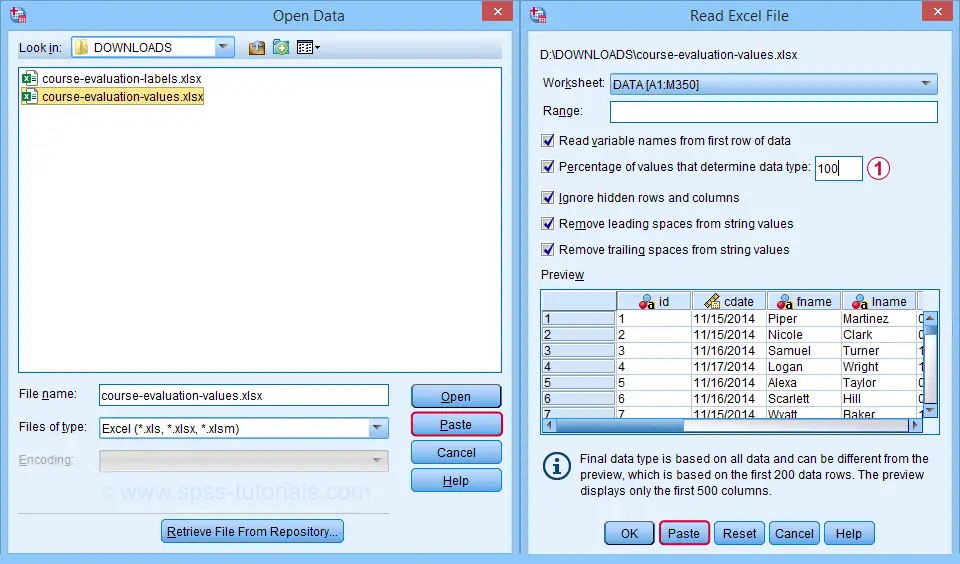
 By default, SPSS converts Excel columns to numeric variables if at least 95% of their values are numbers. Other values are converted to system missing values without telling you which or how many values have disappeared. This is very risky but we can prevent this by setting it to 100.
Completing these steps results in the SPSS syntax shown below.
GET DATA
/TYPE=XLSX
/FILE='D:\data\course-evaluation-values.xlsx'
/SHEET=name 'DATA'
/CELLRANGE=FULL
/READNAMES=ON
/LEADINGSPACES IGNORE=YES
/TRAILINGSPACES IGNORE=YES
/DATATYPEMIN PERCENTAGE=100.0
/HIDDEN IGNORE=YES.
Result
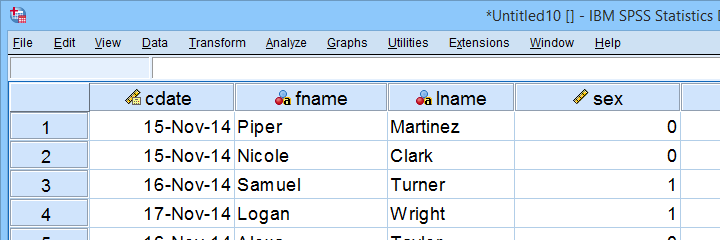
As shown, our actual data are now in SPSS. However, we still need to add their labels from the other Excel sheets. Let's start off with variable labels.
Apply Variable Labels from Excel
A quick and easy way for setting variable labels is creating SPSS syntax with Excel formulas: we basically add single quotes around each label and precede it with the variable name as shown below.
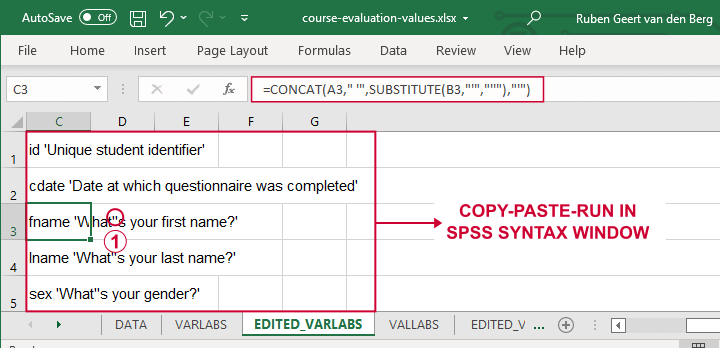
 If we use single quotes around labels, we need to replace single quotes within labels by 2 single quotes.
Finally, we simply copy-paste these cells into a syntax window, precede it with VARIABLE LABELS and end the final line with a period. The syntax below shows the first couple of lines thus created.
variable labels
id 'Unique student identifier'
cdate 'Date at which questionnaire was completed'.
Apply Value Labels from Excel
We'll now set value labels with the same basic trick. The Excel formulas are a bit harder this time but still pretty doable.
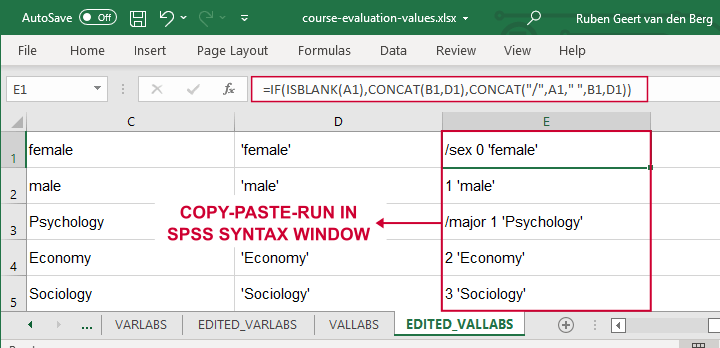
Let's copy-paste column E into an SPSS syntax window and add VALUE LABELS and a period to it. The syntax below shows the first couple of lines.
value labels
/sex 0 'female'
1 'male'
/major 1 'Psychology'
2 'Economy'
3 'Sociology'
4 'Anthropology'
5 'Other'.
After running these lines, we're pretty much done with this file. Quick note: if you need to convert many Excel files, you could automate this process with a simple Python script.
Open Excel Files with Strings in SPSS
Let's now convert course-evaluation-labels.xlsx, partly shown below.
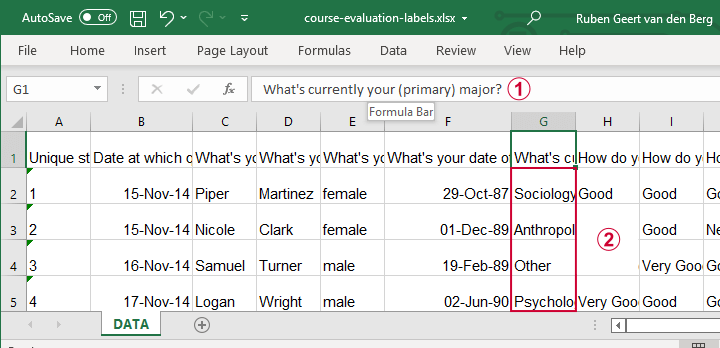
 Note that the Excel column headers are full question descriptions;
 the Excel cells contain the actual answer categories.
Let's first open this Excel sheet in SPSS. We'll do so with the exact same steps as in Open Excel File with Values in SPSS, resulting in the syntax below.
GET DATA
/TYPE=XLSX
/FILE='d:/data/course-evaluation-labels.xlsx'
/SHEET=name 'DATA'
/CELLRANGE=FULL
/READNAMES=ON
/LEADINGSPACES IGNORE=YES
/TRAILINGSPACES IGNORE=YES
/DATATYPEMIN PERCENTAGE=100.0
/HIDDEN IGNORE=YES.
Result
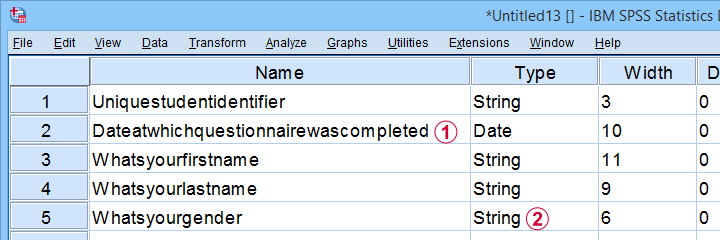
 This Excel sheet results in huge variable names in SPSS;
 most Excel columns have become string variables in SPSS.
Let's now fix both issues.
Shortening Variable Names
I strongly recommend using short variable names. You can set these with RENAME VARIABLES (ALL = V01 TO V13). Before doing so, make sure all variables have decent variable labels. If some are empty, I often set their variable names as labels. That's usually all information we have from the Excel column headers.
A simple little Python script for doing so is shown below.
begin program python3.
import spss
spssSyn = ''
for i in range(spss.GetVariableCount()):
varlab = spss.GetVariableLabel(i)
if not varlab:
varnam = spss.GetVariableName(i)
if not spssSyn:
spssSyn = 'VARIABLE LABELS'
spssSyn += "\n%(varnam)s '%(varnam)s'"%locals()
if spssSyn:
print(spssSyn)
spss.Submit(spssSyn + '.')
end program.
Converting String Variables from Excel
So how to convert our string variables to numeric ones? This depends on what's in these variables:
- for quantitative string variables containing numbers, try ALTER TYPE;
- for nominal answer categories, try AUTORECODE;
- for ordinal answer categories, use RECODE or try AUTORECODE and then adjust their order.
For example, the syntax below converts “id” to numeric.
alter type v01 (f8).
*CHECK FOR SYSTEM MISSING VALUES AFTER CONVERSION.
descriptives v01.
*SET COLUMN WIDTH SOMEWHAT WIDER FOR V01.
variable width v01 (6).
*AND SO ON...
Just as the Excel-SPSS conversion, ALTER TYPE may result in values disappearing without any warning or error as explained in SPSS ALTER TYPE Reporting Wrong Values?
If your converted variable doesn't have any system missing values, then this problem has not occurred. However, if you do see some system missing values, you'd better find out why these occur before proceeding.
Converting Ordinal String Variables
The easy way to convert ordinal string variables to numeric ones is to
- AUTORECODE them and
- adjust the order of the answer categories.
We thoroughly covered this method SPSS - Recode with Value Labels Tool (example II). Do look it up and try it. It may save you a lot of time and effort.
If you're somehow not able to use this method, a basic RECODE does the job too as shown below.
recode v08 to v13
('Very bad' = 1)
('Bad' = 2)
('Neutral' = 3)
('Good' = 4)
('Very Good' = 5)
into n08 to n13.
*SET VALUE LABELS.
value labels n08 to n13
1 'Very bad'
2 'Bad'
3 'Neutral'
4 'Good'
5 'Very Good'.
*SET VARIABLE LABELS.
variable labels
n08 'How do you rate this course?'
n09 'How do you rate the teacher of this course?'
n10 'How do you rate the lectures of this course?'
n11 'How do you rate the assignments of this course?'
n12 'How do you rate the learning resources (such as syllabi and handouts) that were issued by us?'
n13 'How do you rate the learning resources (such as books) that were not issued by us?'.
Keep in mind that writing such syntax sure sucks.
So that's about it for today. If you've any questions or remarks, throw me a comment below.
Thanks for reading!
 SPSS TUTORIALS

THIS TUTORIAL HAS 8 COMMENTS:
By Jon K Peck on April 4th, 2023
I meant to add that the STAR JOIN command does not have this equal length limitation.
By Ruben Geert van den Berg on April 5th, 2023
That's interesting.
I never looked into (let alone used) STAR JOIN. I didn't see any purpose for it.
That being said, another major issue with ADD FILES is that inconsistent dictionary information over files is tricky at best.
I wrote a tiny Python script (ages ago, not very good) that checks this consistency over 2+ files. I think you wrote an extension for this as well (Compare Datasets??).
My guess, though, is that very few SPSS users even realize this risk and simply end up with corrupted meta data if inconsistencies are present.
So I think this should have been built into ADD FILES as well. Or at least throw a warning.
By Jon K Peck on April 5th, 2023
The reconciliation of the meta data that ADD/MATCH do is logical but may, indeed, produce inconsistent results.